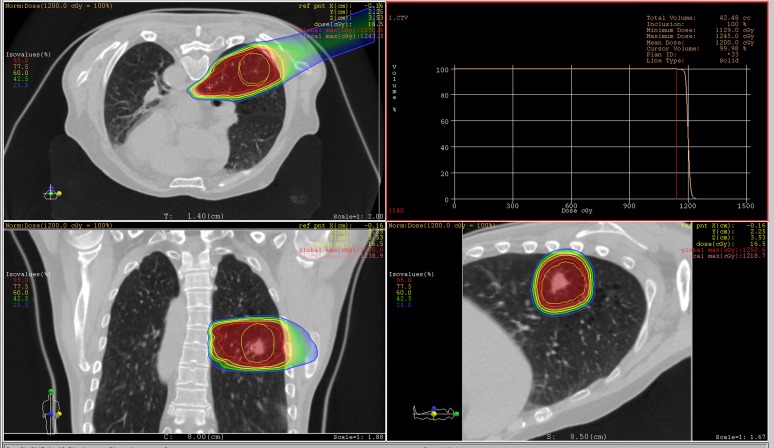
Figure 6.
Carbon-ion dose distribution at the reference phase (T70, mid inhalation). The beam angle was set to 20°. The red line around the target shows the clinical target volume. Red, orange, yellow, light green and blue lines out of the internal target volume are the 95%, 77.5%, 60%, 42.5% and 25% isodose lines, respectively. The right upper panel shows dose–volume histogram analysis. GTV, gross tumour volume; max, maximum; norm, normal; ref pnt, reference point. For colour images see online: www.birpublications.org/doi/abs/10.1259/bjr.20140233.

