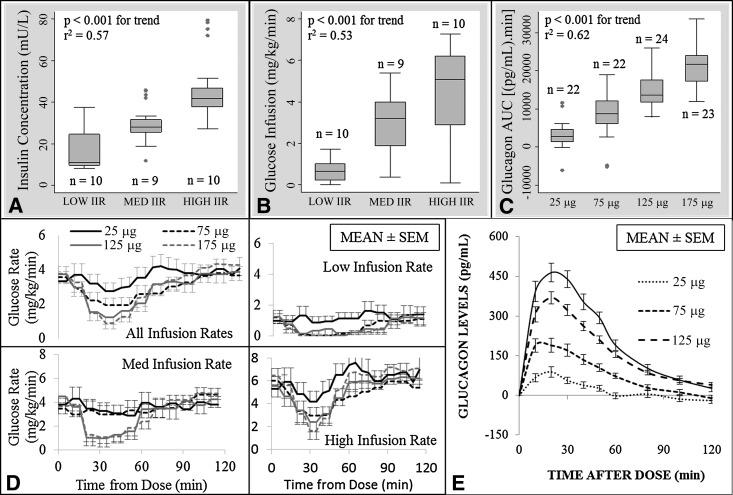
Figure 1.
A: Box plot of serum insulin levels (mU/L) at low, medium, and high insulin infusion rates with results of ANOVA. B: Box plot of dextrose (D10%) infusion rate (mg/kg/min) across all studies, by insulin infusion rate group, with results of ANOVA. C: Box plot of glucagon serum level AUC over 60 min, stratified by dose, with results of ANOVA. D: Mean dextrose infusion (mg/kg/min) over time by insulin infusion rate group and glucagon dose: top left, all infusion rates together; top right, bottom left, and bottom right, low, medium, and high insulin infusion rates, respectively. E: Mean incremental change in glucagon serum levels (baseline corrected at time = 0). IIR, insulin infusion rate.

