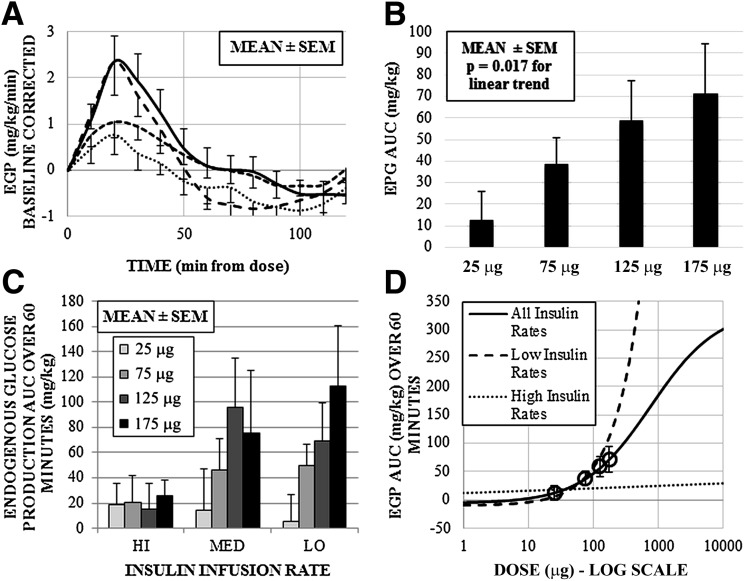
Figure 2.
A: Time profiles of calculated EGP by glucagon dose, baseline corrected for EGP at the time of the dose. B: Mean EGP AUC over 60 min after the dose. C: Three-dimensional graph of mean EGP AUC separated by glucagon dose and insulin infusion rate. D: MATLAB-generated dose-response curve across all doses, and for low and high insulin infusion rate experiments, estimated from study data. Response means for 25-, 75-, 125-, and 175-μg doses indicated by open circles, with 95% CI error bars. Coefficients for parameters of the sigmoid curve with 95% CI: −5.8 (−50 to 272), 336.5 (−3,800 to 3,900), 759.1 (−15,800 to 15,900), and −0.8 (−30.5 to 28.9).

