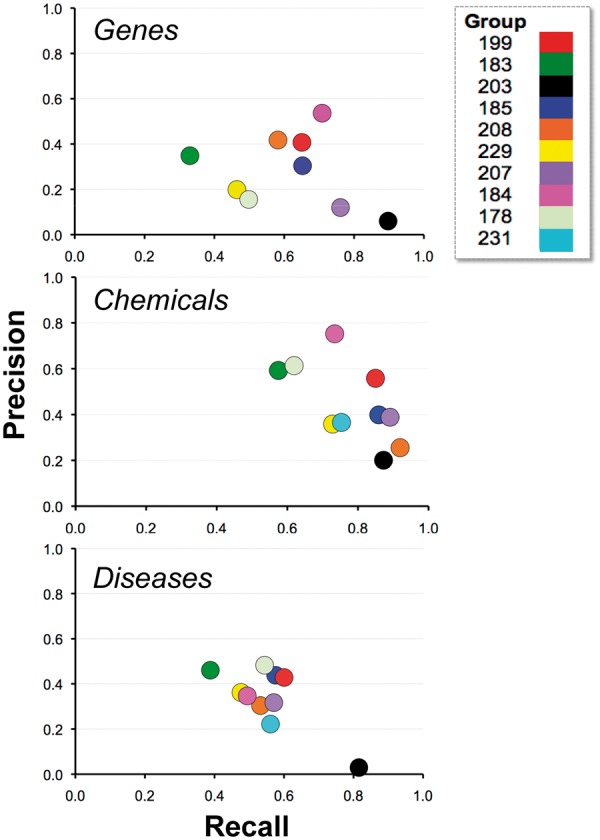
Figure 10.

Recall and precision. Combined average recall (x-axis) and precision (y-axis) results are shown for each participating group (color-coded by group number) within major NER category. For some groups there appeared to be a clear trade-off between recall and precision (e.g. 203), whereas for other groups trade-offs were less apparent (e.g. 184 and 199).
