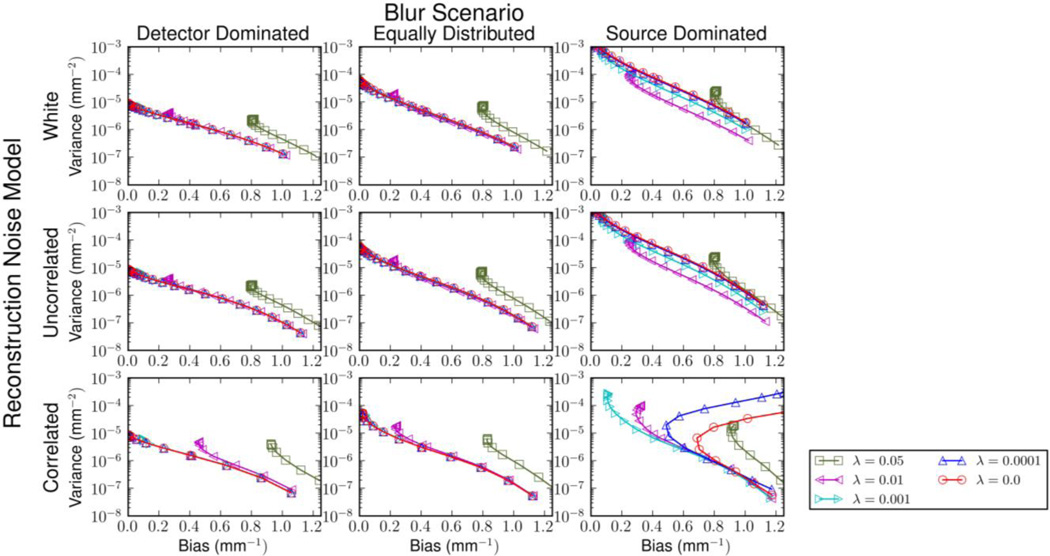
Fig. 3.
Plots of bias versus variance for the three noise models of reconstruction and the three system blur scenarios. The plots contain a summary of results from the two-dimensional parameter sweep over λ and β. Within each plot five separate curves for fixed λ are shown. Individual curves are generated by sweeps over β. The importance of regularization in the deblurring step is most important in the source dominated scenario where nonzero λ values improve the bias-variance relationship for each reconstruction noise model.

