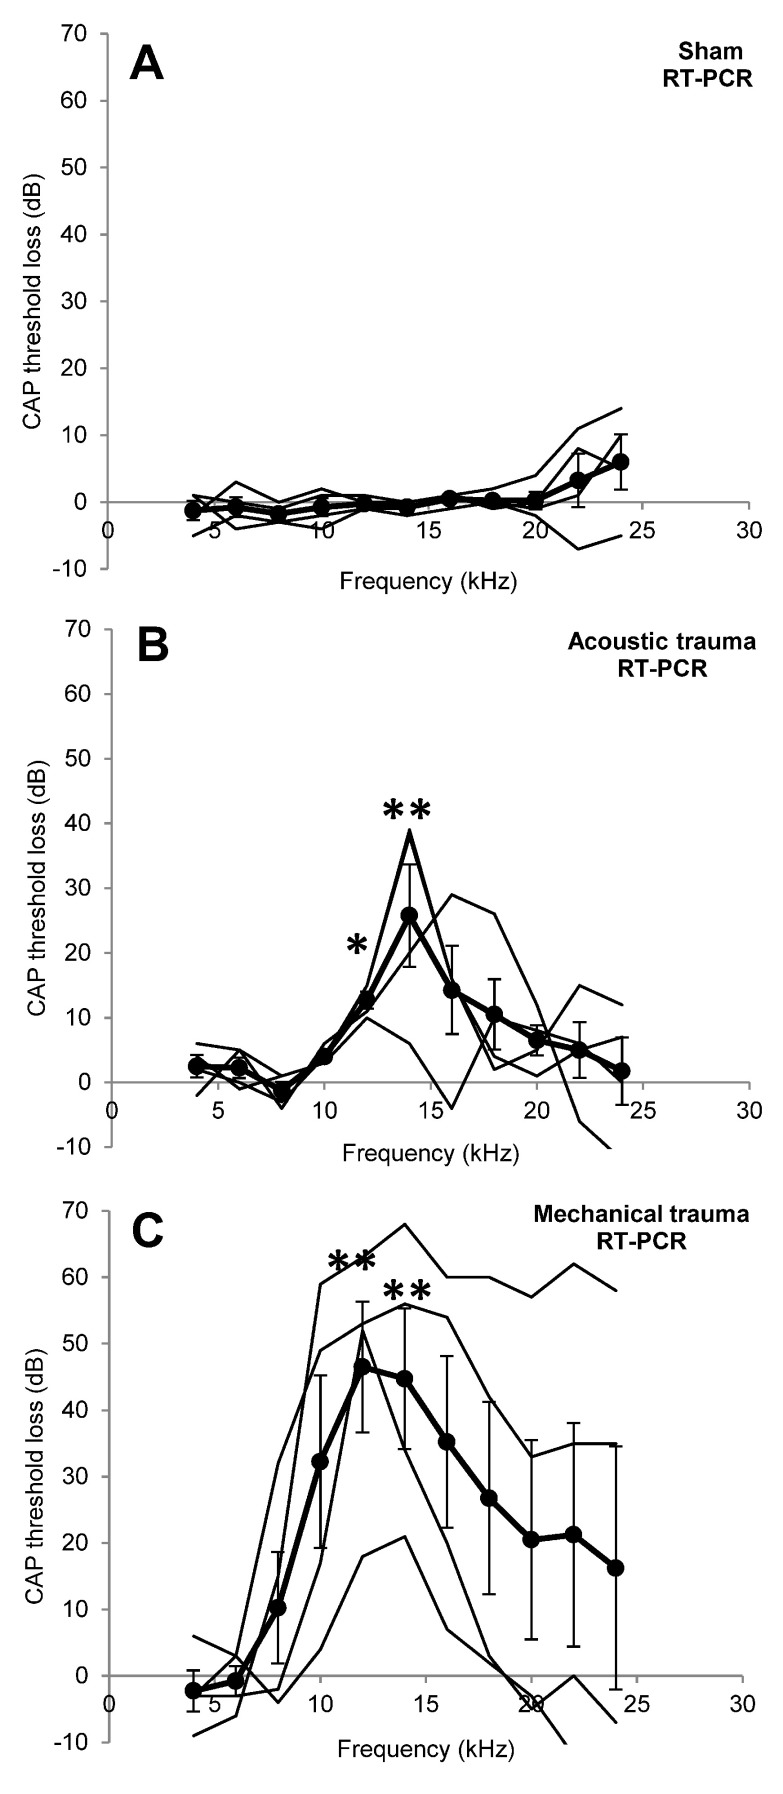
Figure 1. Peripheral hearing loss.
Changes in cochlear sensitivity measured as CAP threshold loss recorded in the left cochlea after recovery from sham surgery ( A), acoustic trauma ( B) or mechanical trauma ( C). Thick black lines indicate the mean ± SEM (n=4 for all), thin black lines represent individual animals. * p<0.05, ** p<0.01 compared to before treatment data.

