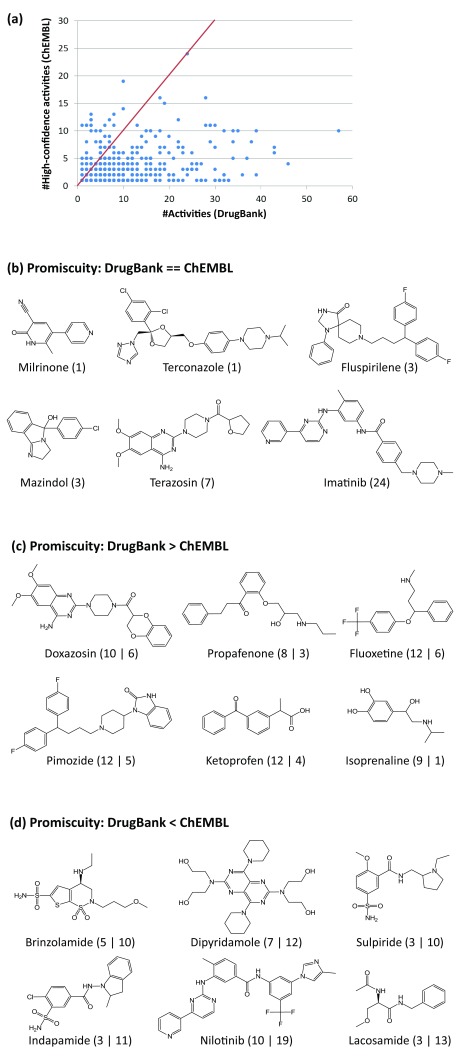
Figure 2. Drug promiscuity in DrugBank vs ChEMBL.
( a) For 518 qualifying drugs, the number of targets reported in DrugBank and the number of high-confidence activity annotations in ChEMBL are compared in a scatter plot. Each dot represents a drug. The diagonal (indicating perfect correlation) is drawn in red. In ( b), ( c), and ( d), exemplary drugs are shown that had the same number of targets in DrugBank and ChEMBL (i.e., the same promiscuity rate), a higher promiscuity rate in DrugBank, and a higher rate in ChEMBL, respectively. For each drug in ( b), the number of targets is given. For each drug in ( c) and ( d), the numbers of targets reported in DrugBank and ChEMBL are compared. For example, “10 | 6” indicates that the drug was annotated with 10 targets in DrugBank and with six in ChEMBL.

