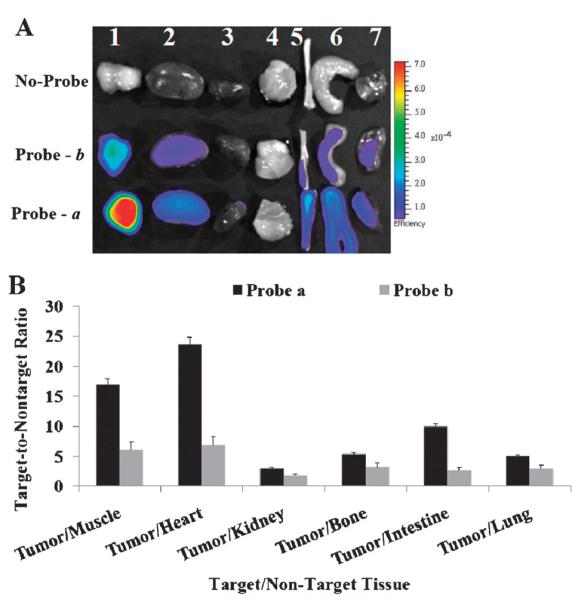
Fig. 3.
(A) Ex vivo fluorescence image of excised representative organs and tissues 48 h post injection; 1, Cath E-positive MPanc96-E tumor; 2, kidney; 3, heart; 4, muscle; 5, bone; 6, small intestine; 7, lung. (B) Target-to-nontarget fluorescence ratio of probes a and b in MPanc96-E tumor and representative organs and tissues 48 h post injection. The controls ROI represent an average of the pixels every-where in the ex vivo organs image except within the pixels of interest in the field of an identical size of the tumor image.

