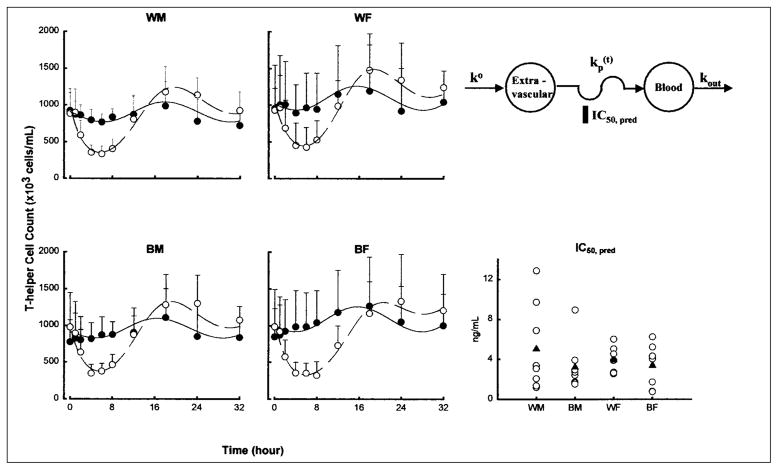
Figure 4.
Time course of mean ± SD and fitted blood T-helper lymphocyte counts. Symbols show experimental data, and lines show the fittings to the pharmacodynamic model shown. Symbols and lines are defined in the legend of Figure 3. The comparative free prednisolone IC50 values of T-helper cell inhibition are also shown for individual subjects (open circles) as well as group mean values (filled triangles).

