
Fig. 5.
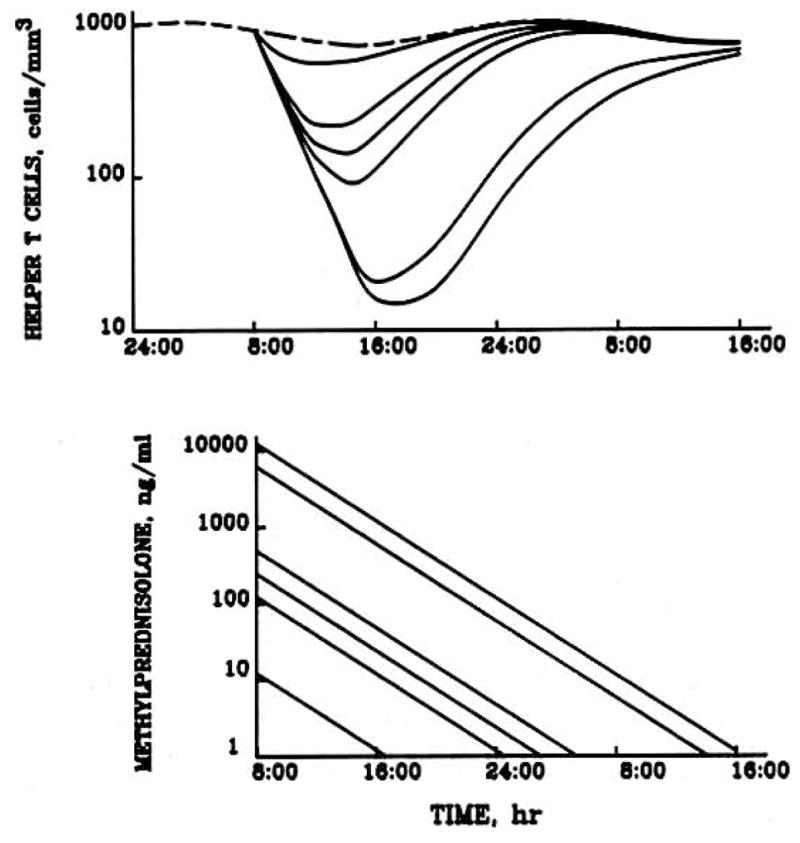
Model simulations of the expected behavior of helper T cell numbers in blood (upper graph) including baseline (dashed line) and serum methylprednisolone concentrations (lower graph) following iv methylprednisolone doses of 0, 1, 10, 20, 40, 500, and 1000 mg (upper to lower curves in top graph, conversely in lower graph).