
Figure 2.
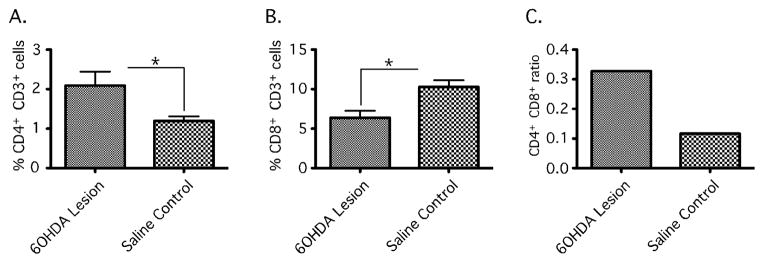
Changes in Cerebral T cell populations in the 6-OHDA lesioned RNU−/+ rat brain assessed by Flow cytometry. Striatal and nigral tissue was isolated from RNU−/+ rats 4 weeks after receiving unilateral 6-OHDA toxin or saline as control. Ipsilateral and contralateral to lesion tissue was isolated and dissociated to single cell suspensions for immunocytochemistry to identify CD3+CD4+ and CD3+CD8+ T cells. Cells were than analyzed by flow cytometry and expressed as percent of gated lymphocytes. 6-OHDA tissue showed a significant increase in CD3+CD4+ (%2.091−/+ 0.3538 vs. %1.195 −/+ 0.1160; *, P= 0.0210) immunopositive cells and decrease in CD3+CD8+ (%6.382−/+ 0.8912 vs. %10.27−/+ 0.8661; *, P=0.0034) immunopositive cells as compared to saline injected controls (A+B) and an increase in the ratio of CD4+CD8+ in 6-OHDA RNU−/+ as compared to controls (C). Error bars equal SEM (*, P<0.05).