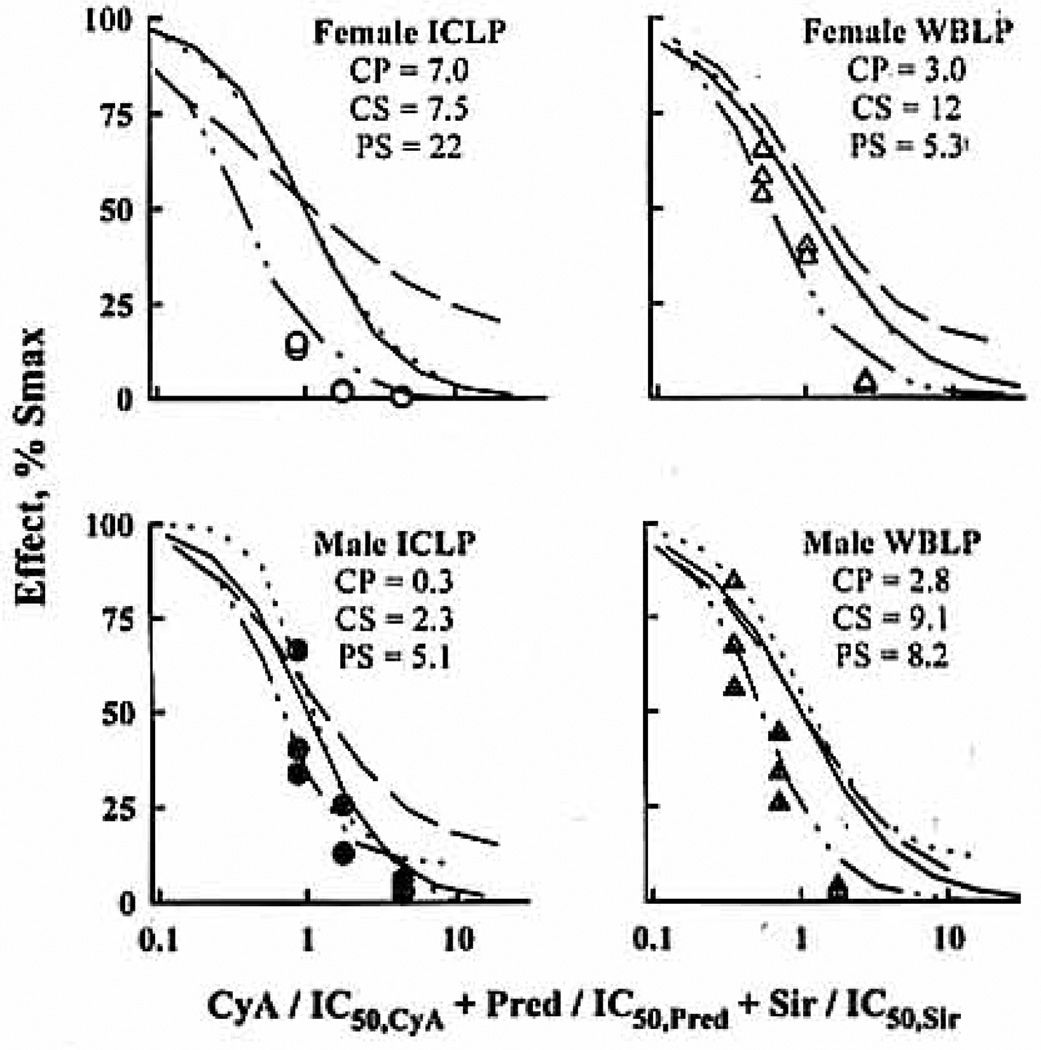
Figure 5.
URSA applied to the triple-drug interaction. CsA (·····), Pred (——), and Sir (— — —) single-agent effects are simulated along with the triple-combination effects assuming double-drug interaction a values. Observed effects are reported for the ratio 1:1:1 at the IC50. Drug concentrations were normalized by their IC50 values. A shift of the interaction curve to the left (or right) of predicted combined effects will have indicated additional synergism (or antagonism) within the triple combination. Double-interaction α values are reported for CsA/Pred (CP), CsA/Sir (CS), and Pred/Sir (PS).

