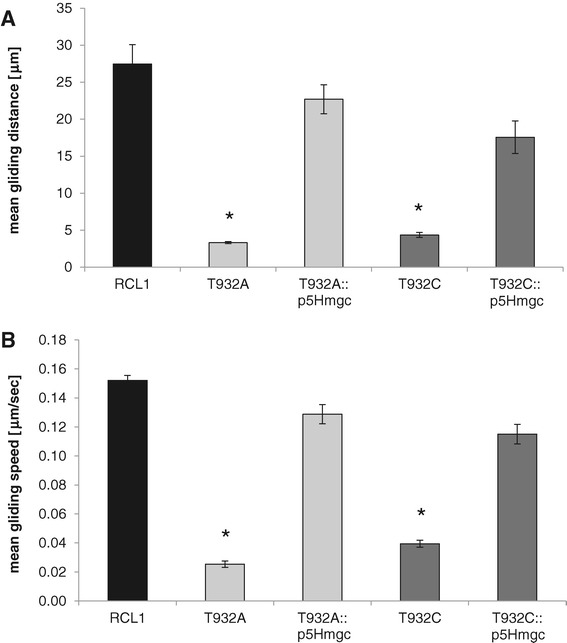
Figure 6.

Quantitative analysis of gliding motility. Time-lapse cinematography was performed for cultures of parental strain RCL1 and the gliding-deficient transposon mutants (T932A, T932C) and mgc2-complemented mutants (T932A::p5Hmgc, T932C::p5Hmgc). Using the image processing Fiji package, movies were analyzed to determine the gliding distance (A) and the average speed (B) of mycoplasmas. The mean values from three independent experiments are shown. Statistically significant differences to RCL1 (P ≤ 0.05) are marked by asterisks.
