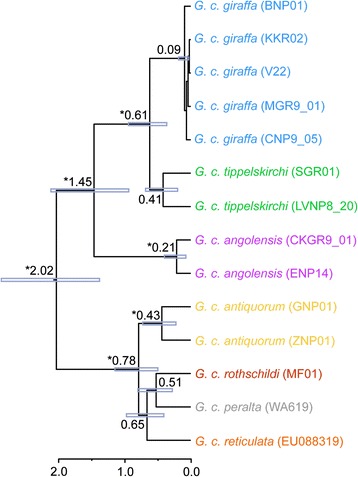
Figure 2.

Maximum clade credibility tree of the major giraffe populations as reconstructed by Bayesian analysis conducted in BEAST. Blue bars indicate 95% highest posterior density intervals for node ages, asterisks denote posterior probability >0.95. Scale on the bottom represents divergence time (million years ago).
