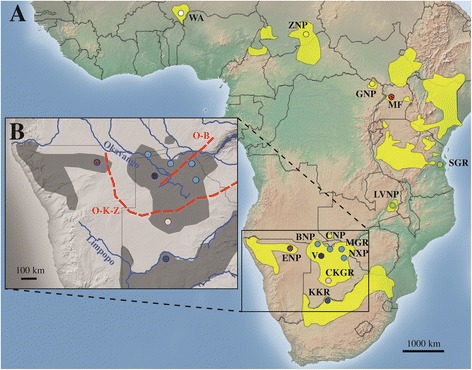
Figure 3.

Map of sub-Saharan Africa. A: Distribution range of giraffe (yellow patches) and sampling locations (abbreviations are explained in Table 1). Colors show genetically identified subspecies (coding as in Figure 1). B: Depiction of southern African giraffe populations and location of geographic boundaries. O-K-Z: Owambo-Kalahari-Zimbabwe epigeiric axis, O-B: Okavango-Bangweulu axis.
