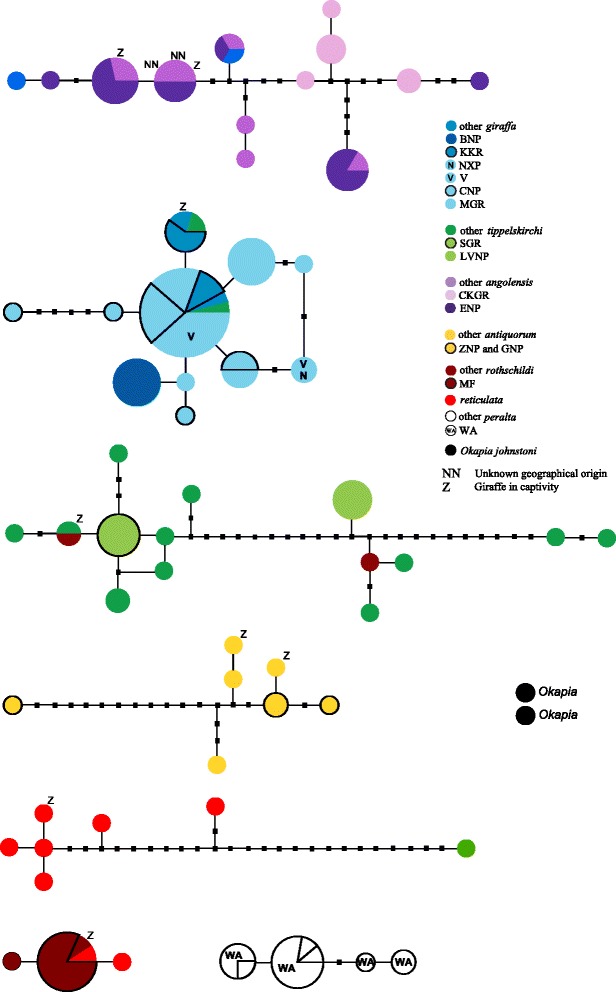
Figure 4.

Statistical parsimony haplotype network of the giraffe and okapi sequences. The sub-networks of different giraffe subspecies do not connect at the 95% connection probability limit. Different populations having identical haplotypes are indicated by pie-sections. Black rectangles indicate not sampled haplotypes. Abbreviations as in Table 1.
