
Figure 5.
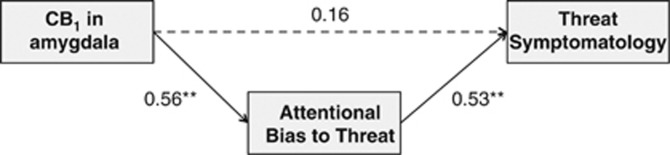
Path model of associations between CB1 receptor availability measured with [11C]OMAR and positron emission tomography in the amygdala, attentional bias to threat, and threat symptomatology. **Significant association, p<0.01. The r2 for negative attentional bias=0.28; r2 for threat symptomatology=0.31. The dashed line indicates a nonsignificant association. The 95% confidence intervals for CB1 → attentional bias to threat =0.01–0.95; for attentional bias to threat → threat symptomatology =0.16–0.85.