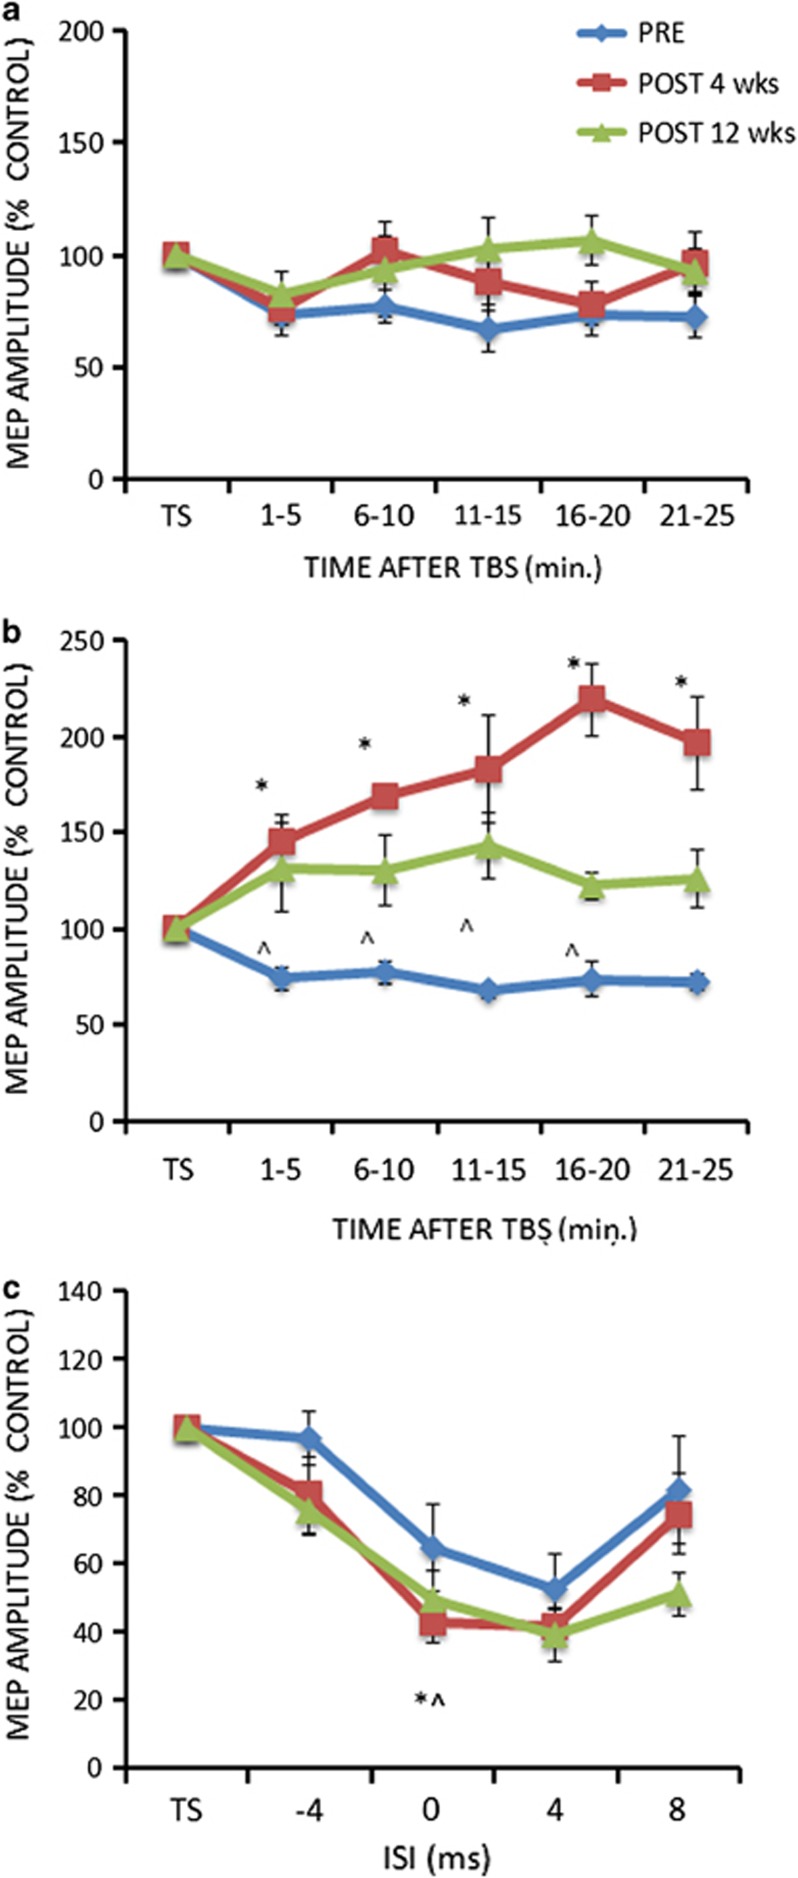
Figure 5.
After effects of the cTBS (a) and iTBS (b) protocols on MEP amplitude in the RTG Alzheimer's disease patients group at baseline (pre), after 4 and 12 weeks of treatment with RTG. (c) After effects of the SAI protocols on MEP amplitude in the RTG Alzheimer's disease patients group at baseline (pre), after 4 and 12 weeks of treatment with RTG. The figure shows the results of the subgroup of patients (n=7) involved in the whole 12 weeks course. Error bars indicate SEM. *p<0.05 between the 4 weeks and the baseline evaluation. ^p<0.05 between the 12 weeks and the baseline evaluation.

