
Figure 2.
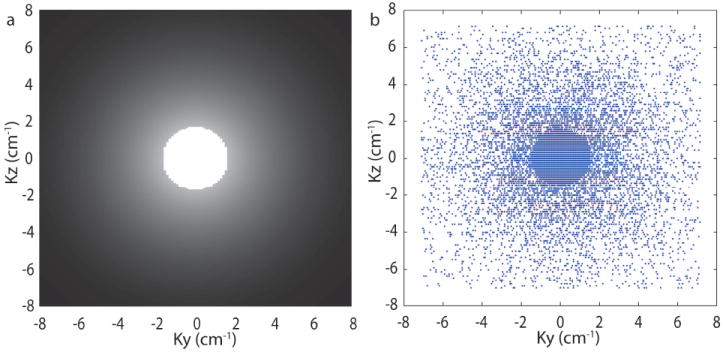
(a) Log-histogram and (b) Histogram of wavelet coefficients in one subband of a representative carotid image. The red line is a mixture of two-component Gaussians fitted to the data and the blue line is the approximation from a mixture of two-component generalized Gaussians. The generalized Gaussian mixture provides a better fit than Gaussian mixture.