
Figure 7.
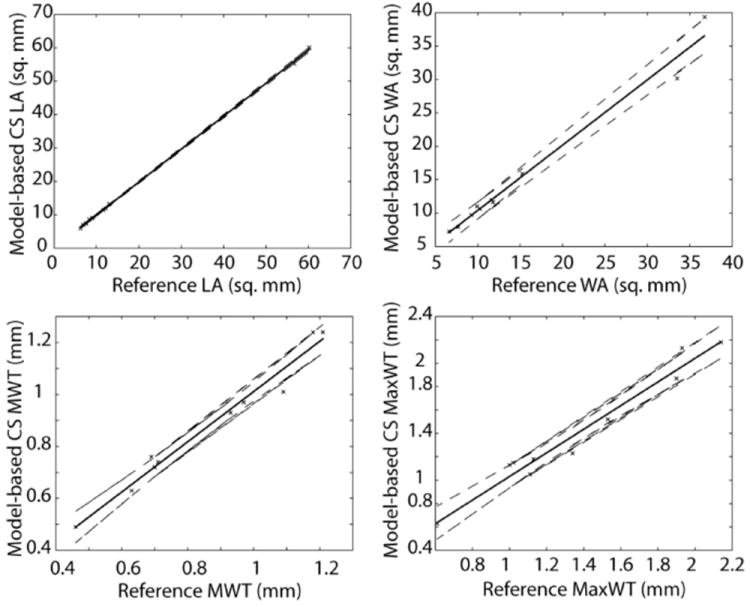
Correlation of lumen area (LA), wall area (WA), mean wall thickness (MWT) and max wall thickness (MaxWT) between reference and HMT model-based CS reconstruction. Solid and dashed lines correspond to linear regression line and 95% confidence intervals respectively.