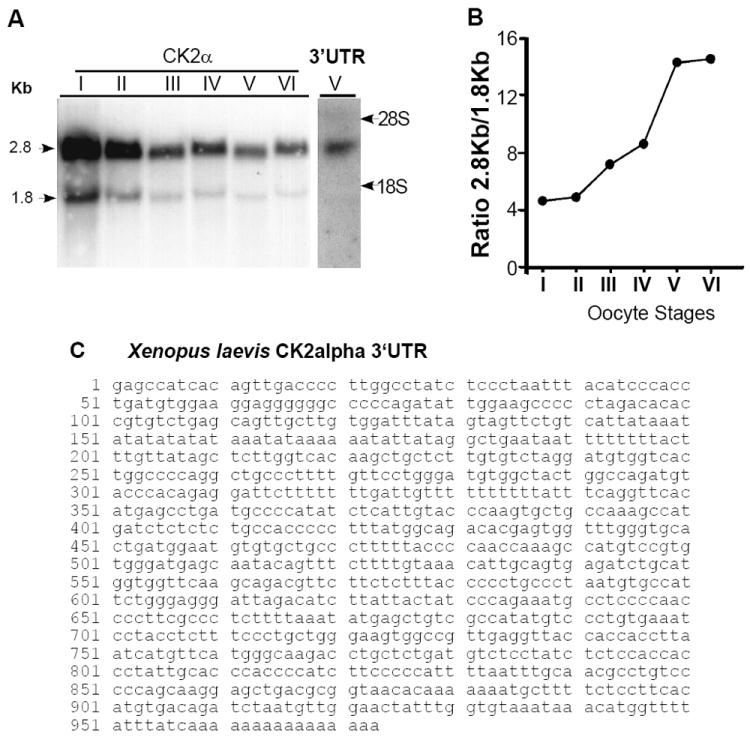
Figure 4. Analysis of CK2α transcripts during oogenesis and sequence of the XCK2α 3’UTR.

(A) Northern blot analysis of RNA extracted from different stages of Xenopus laevis oogenesis using a CK2α coding sequence probe (CK2α, left columns) or probe specific to the CK2α 3’UTR (3’UTR, right column). Analysis shows two major CK2α transcripts, estimated at 2.8 kb and 1.8 kb. The upper band was identified as containing the 3’UTR sequence. Position of the 28S and 18S rRNA bands is marked. The northern blots were performed twice with similar results. As younger oocytes express less RNA than late oocytes, we loaded RNA from 2.5 stage I oocytes, 1.3 stage II oocytes, 0.52 stage oocytes III, 0.08 stage IV oocytes, 0.03 stage V oocytes and 0.01 stage VI oocytes.
(B) Graph representing the ratio of the 2.8kb to 1.8kb XCK2α transcripts quantified from the Northern blot in Figure 4B.
(C) An EST clone containing a XCK2α and its 3’UTR was identified (IMAGE ID: 4971090, BC072167 / Genbank Accession #: CF289385/CF289386) and sequenced. The 3’UTR was defined as starting at the first base downstream of the stop codon.
