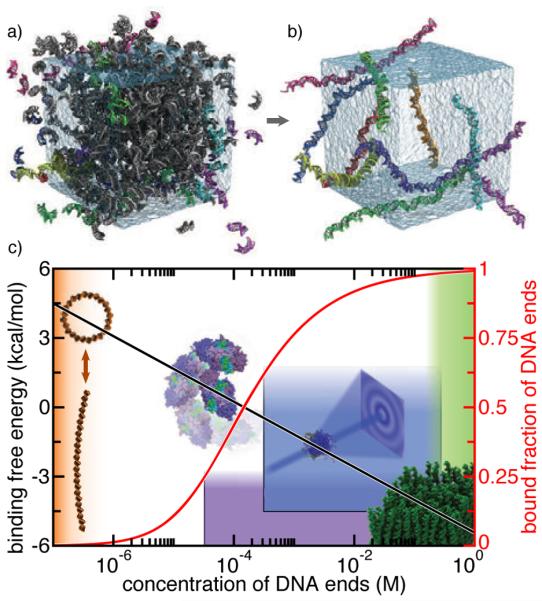
Figure 13.

End-to-end association of duplex DNA fragments. (A) Simulation system containing a solution of 458 DNA fragments near the density of the experimentally determined isotropic–nematic phase transition [273]. Most DNA fragments are shown in grey. Those fragments that formed the ten largest end-to-end chains at the end of the simulation are shown in color. The simulation used periodic boundary conditions, lasted 260 ns and included about 1,500,000 atoms. Water in the simulation unit cell is shown as a semitransparent molecular surface. (B) The ten largest end-to-end chains at the end of the simulation. The kinetic association and dissociation rates enabled estimation of the standard binding free energy of the end-to-end interaction. (C) End-to-end attraction in different DNA systems. The effective binding free energy (black) and the fraction of bound DNA ends (red) are plotted against the reference concentration of DNA ends. Images illustrate four DNA systems in which the end-to-end attraction may or may not play a role. From top left to bottom right: blunt-ended DNA circles (orange); repair of DNA during non-homologous end joining [276] (purple); small-angle x-ray scattering experiments [130] (blue); DNA aggregation into liquid crystal phases [273] (green). Figures adapted with permission from Ref. 75.
