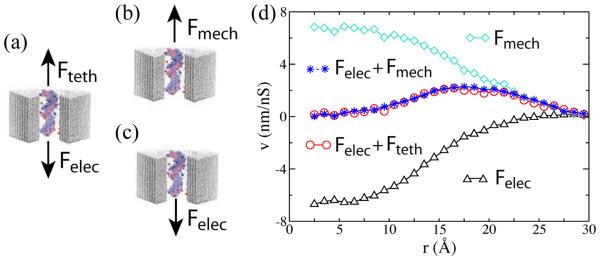
Figure 15.

Electroosmotic screening of the DNA charge. (a) A stationary DNA fragment is subject to a restraining force Fteth and an electrophoretic force Felec. (b) The DNA fragment is displaced through the nanopore with a constant velocity by a mechanical pulling force Fmech. (c) The DNA fragment is displaced through the nanopore by an electrophoretic force Felec. (d) Water velocity as a function of radial position, calculated from all-atom MD simulations corresponding to the setups shown in panels a–c. The DNA surface is located at approximately 11 Å; the surface of the nanochannel is located at ~30 Å. A superposition (blue stars) of the flow profiles observed in mechanical pulling (cyan diamonds; panel b) and electrophoresis (black triangles; panel c) simulations reproduces the flow profile observed in the simulations of the effective electrophoretic force (red circles; panel a). Positive values of the water velocity corresponds to the upward direction in panels a–c. The data were taken from Ref. 316.
