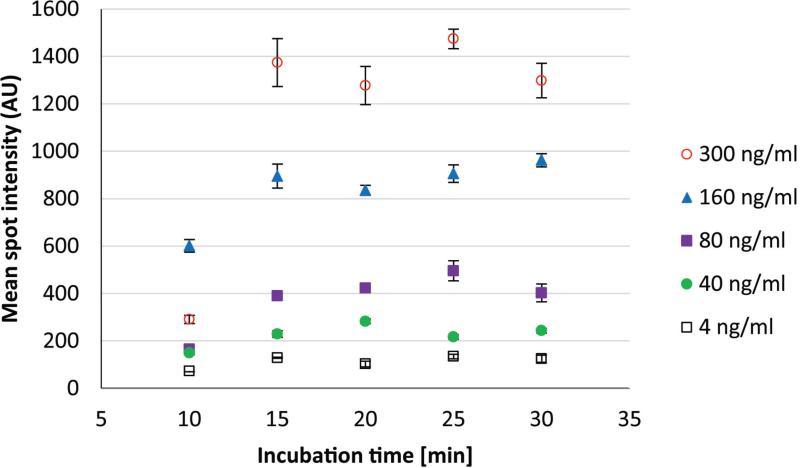
Figure 2.
Fluorescence detection results for PSA-spiked female plasma sample. PSA-spiked plasma perfused a flow cell holding the porous silicon antibody microarray for 10, 15, 20, 25 and 30 minutes (X-axis) to optimize the continuous flow PSA assay. Mean spot intensities (Y-axis) and standard deviation (error bars) were calculated from spots (N=9) obtained from microarray image analysis. Note that incubation time of more than 15 minutes did not result in a significantly higher mean spot intensity, thus this time was selected for the subsequent IAI protocol.

