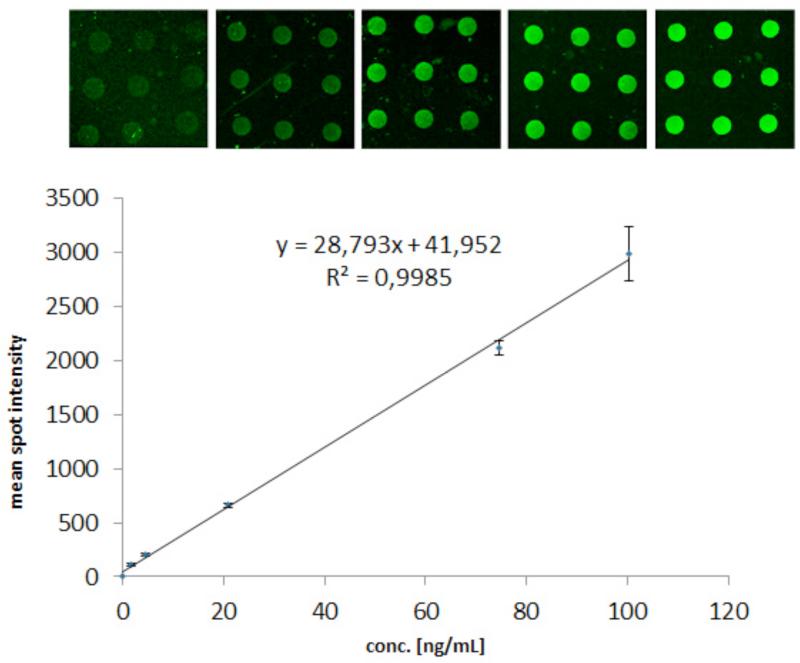
Figure 7.
Fluorescence readout of the titrated series of PSA-spiked female whole blood obtained via the IAI protocol. The insert images show microarray images of the corresponding concentration ranges. Mean spot intensities (Y-axis) and standard deviations (error bars) were calculated from the spots (N=9) in the images captured via a 20× lens. The PSA concentrations on the X-axis were obtained by the DELFIA reference assay.

