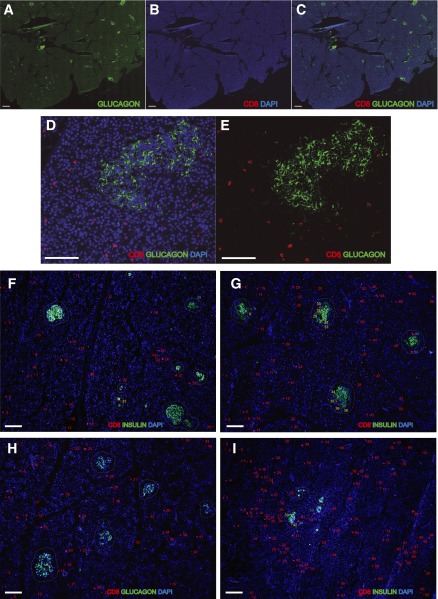
Figure 1.
Quantification of CD8+ T cells in pancreatic tissue sections. Representative quantification of CD8 T cells in pancreata is shown (see Research Design and Methods for details). A–E: Frozen pancreas sections from a T1D donor with <5 years of disease duration were stained for glucagon and CD8. Images were acquired using a BIOREVO BZ-9000 slide scanner system (Keyence, Osaka, Japan). Representative images of exocrine and endocrine pancreatic CD8 T cell quantification in healthy (F), Ab+ (G), T1D (H), and T2D donors (I). Numbers represent CD8 T cell quantification in the exocrine pancreas (in red), in the periphery of the islet (in blue), and in the endocrine tissue (in yellow). The contour of the islets is defined by a dashed line. Scale bars, 500 μm in A–C and 100 μm in D–I.

