
Figure 2.
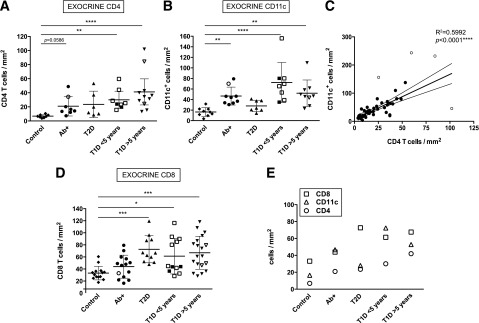
Diabetic donors present high exocrine infiltration. A, B, and D: Mean exocrine density values (cells/mm2) for each donor and group are shown for CD4+, CD11c+, and CD8+. (CD4: n = 10 for control subjects, n = 8 Ab+, n = 6 T2D, n = 8 T1D <5 years, and n = 11 T1D >5 years. CD11c: n = 10 control subjects, n = 9 Ab+, n = 8 T2D, n = 9 T1D <5 years, and n = 10 T1D >5 years. CD8: n = 15 control subjects, n = 14 Ab+, n = 11 T2D, n = 12 T1D <5 years, and n = 19 T1D >5 years.) Open symbols indicate donors in which the nPOD Pathology Core found signs of insulitis. C: Linear regression analysis of CD4 and CD11c density (n = 42). Outliers are shown as open circles. The corresponding R2 and P values are indicated in the graph. E: Mean density value (cells/mm2) for CD8+, CD4+, and CD11c+ cells for the exocrine pancreas is shown. For statistical analysis, nonparametric Kruskal-Wallis test followed by Dunn multiple comparisons test was used to determine significance. Linear regression analysis was used in C. Outliers were identified using the Rout method (FDR of 1% [Q = 1]). Two and one outliers from the control group were identified in A and D, respectively; in B, one control, one T2D, and two T1D donors were identified as outliers. *Significant difference between groups (P ≤ 0.05); **significant difference between groups (P ≤ 0.01); ***significant difference between groups (P ≤ 0.001); ****significant difference between groups (P ≤ 0.0001).