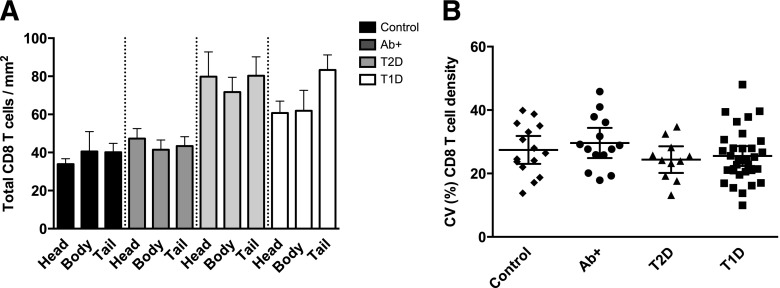
Figure 5.
CD8 T cells are similarly distributed in the pancreas of diabetic donors and control subjects. A: Bars represent mean CD8 T cell density (cells/mm2) for each region (head, body, and tail) and group (n = 23 control subjects, n = 32 Ab+, n = 21 T2D, and n = 33 T1D). Mean ± SEM values are shown. B: Population mean and 95% CIs of interimage variation (CV) in total CD8 T cell density are shown for each donor and group (n = 15 control subjects, n = 14 Ab+, n = 11 T2D, and n = 31 T1D). For statistical analysis, one-way ANOVA with Holm-Sidak multiple comparisons test in B and Kruskal-Wallis followed by Dunn multiple comparisons test in A were used to determine significance.

