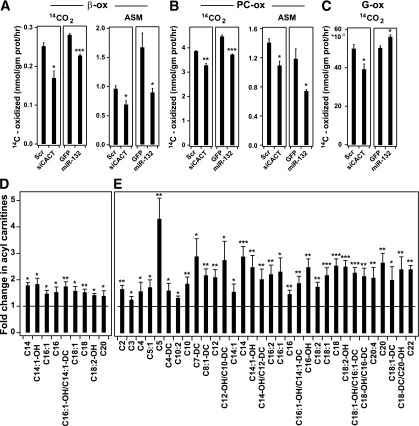
Figure 4.
CACT knockdown reduces β-oxidation and leads to acyl-carnitine accumulation. A–C: siCACT and miRNA 132 both blunt β-oxidation. INS-1 832/13 cells were transfected with CACT siRNAs or scrambled (Scr) oligonucleotides as negative control or were infected with Ad-GFP or Ad-miRNA-132. Palmitate oxidation (14CO2 released and ASM) (A), palmitoyl-carnitine oxidation (14CO2 released and ASM) (B), and glucose oxidation (C) were measured 48 h after transfection/infection, as described in Research Design and Methods. Units for all the graphs are nanomoles 14C per milligram protein per hour. D, E: Metabolic profile demonstrates an accumulation of acyl-carnitines in response to CACT downregulation. INS-1 832/13 cells were transfected with CACT siRNAs or control oligonucleotides (Scr-siRNA) and maintained for 48 h in RPMI supplemented with 1 mmol/L L-carnitine. The culture medium was refreshed without (D) or with (E) PC (50 μmol/L) and 1.5 mmol/L glucose 2 h before harvesting the cells for metabolic profiling. All metabolite measurements in response to CACT siRNA are normalized to control measurements. All bars represent statistically significant upregulation in metabolites. All experiments were performed three times.*P < 0.05; **P < 0.01; ***P < 0.001.

