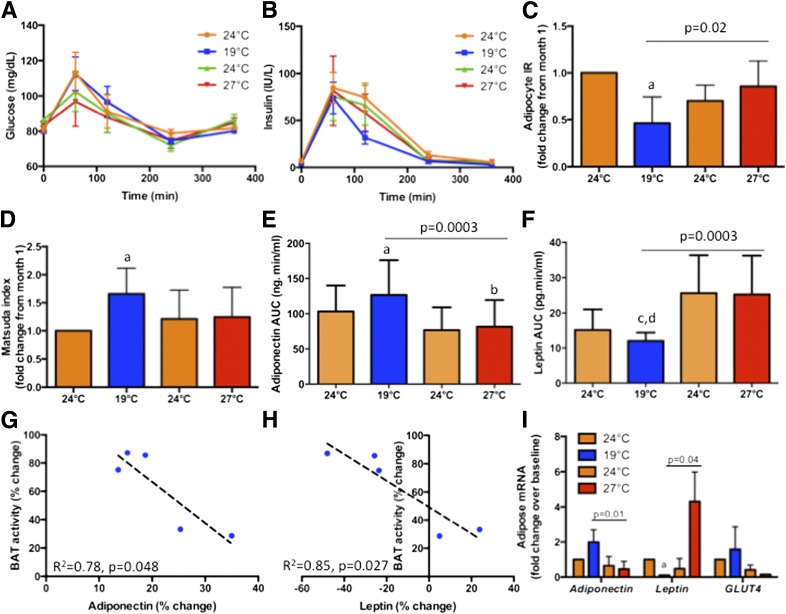
Figure 2.
Metabolic consequences of BAT acclimation at 19°C. A and B: Comparison of postprandial glucose and insulin excursions after a mixed meal at 1300 h before and after cold acclimation, respectively, measured at 19°C. Glucose excursions were unchanged but insulin levels decreased, with a significant reduction in AUC, after mild cold acclimation (month 2). Accordingly, adipocyte insulin resistance (IR) was the lowest (C) and Matsuda index (an indicator of insulin sensitivity) was the highest (D) after cold acclimation (month 2). These changes in glucose metabolism were accompanied by an increase in circulating adiponectin (E) and a decrease in circulating leptin (F). Cold acclimation–induced changes (months 1 and 2) in circulating adiponectin (G) and leptin levels (H) correlated negatively with changes in BAT activity. Adiponectin and leptin mRNA displayed concordant changes in subcutaneous adipose tissue biopsies with circulating levels, and changes in GLUT4 tracked those of adiponectin (I). aP < 0.05 compared with month 1 (24°C), bP < 0.05 compared with month 2 (19°C), cP < 0.05 compared with month 3 (24°C), and dP < 0.05 compared with month 4 (27°C).

