Figure 3.

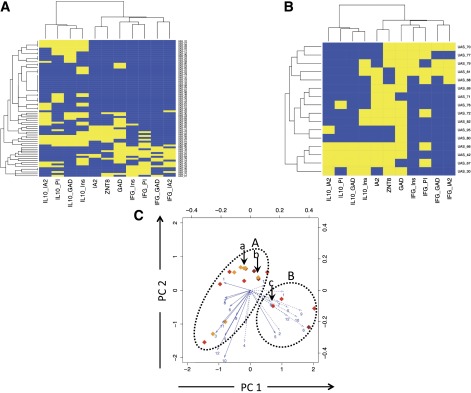
Clustering analysis of autoimmune inflammatory phenotypes in siblings. Unbiased hierarchical clustering analysis of autoimmune CD4 T-cell and AAb responses are represented as heat maps. A: Analysis of unaffected siblings in an unbiased, cross-sectional study. B: Analysis of high-risk, unaffected siblings with multiple (two or more) islet AAb positivity showing two main clusters characterized by the presence of IL-10 with sparse IFN-γ (lower left) and the presence of IFN-γ with sparse IL-10 (upper right). Yellow indicates a positive response to an analyte and blue a negative response. CD4 T-cell peptide-specific responses are summarized into proteins (IA-2, GAD, PI, and Ins). C: Plots showing two principal components (PCs) for siblings with two or more islet AAbs and at high risk of progression to disease; each subject is identified by a diamond, the color of which indicates AAb positivity (open = no AAb; yellow = 1 AAb+; orange = 2 AAb+; red = 3 AAb+; brown = 4 AAb+). For explanation of arrows, see Fig. 1D legend. The same oval outlines as in Fig. 1D are overlaid, and the corresponding clusters A (IFN-γ dominated) and B (IL-10 dominated) are identifiable in high-risk subjects. The subjects identified by arrows a and bin cluster A developed type 1 diabetes (ages 6 and 10 years, respectively, at diagnosis); the subject identified by arrow c in cluster B developed type 1 diabetes at age 18 years. IFG, interferon-γ; Ins, insulin; PI, proinsulin.
