
Figure 6.
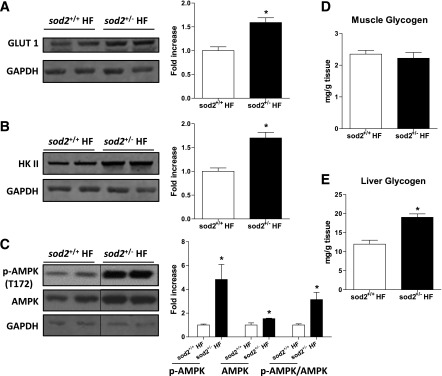
Glucose effectiveness during the HG clamp. (A) Western blotting of GLUT-1, (B) hexokinase II, and (C) phosphorylation of AMPK and total AMPK was performed in gastrocnemius muscle extracts post HG clamp. GAPDH was used as loading control. Representative bands are displayed. The integrated intensities of bands are normalized to chow-fed sod2+/+ and are represented as mean ± SEM. n = 4–5 (males). D and E: Muscle and liver glycogen content was determined in tissues post HG clamp. n = 6–7 (males). *P < 0.05 compared with sod2+/+ HF. HK II, hexokinase II.