
Fig. 1.
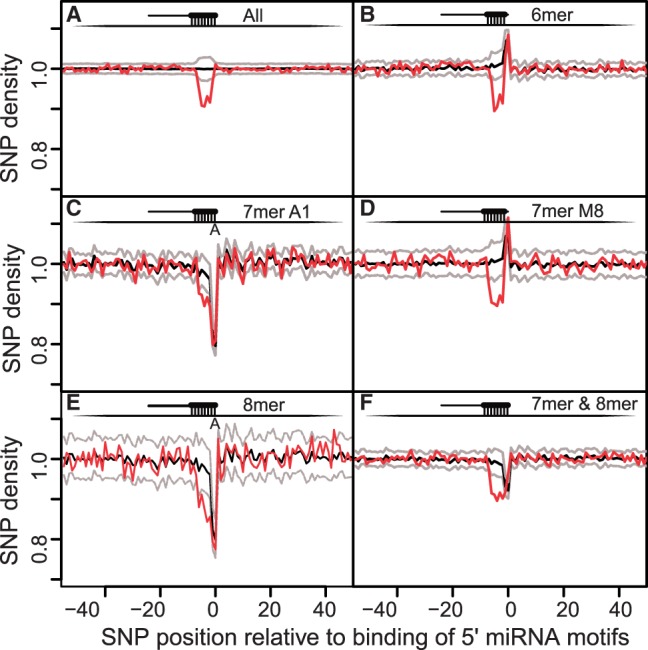
SNP density around miRNA complementary seed sites in circRNA transcripts. The x-axis shows SNP positions relative to predicted binding position of 5′ miRNAs. Values from [−7;−1] show the SNP densities at the seed sites. Panels A–F show respectively, SNP density for all the seed sites, 6mer, 7merA1, 7merM8, 8mer sites and finally all the seed sites except 6mers. Red lines are the actual SNP densities; black and grey lines are, respectively, the median and the 95% CI based on random motifs. We see a significant decrease of SNP density at the miRNA seed sites of circRNAs compared with flanking regions and random seed sites