
Table 3.
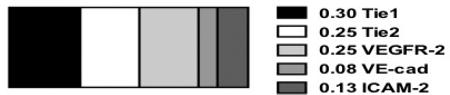
Target gene expression in (B) cardiovascular, (C) renal, and (D) hepatic vasculature following injection of 7C1 complexed with siRNA targeting Luc or Tie1, Tie2, VE-cad, VEGFR-2, and ICAM2. (A) Importantly, a 1 mg/kg total dose consisted of 0.075 mg/kg siVE-cad, 0.125 mg/kg siICAM2, 0.25 mg/kg siVEGFR-2, 0.25 mg/kg siTie2, and 0.30 mg/kg siTie1.
| a | |||||
|---|---|---|---|---|---|
| |||||
| b | |||||
| Total Dose (mg/kg) | 2.0 siLuc | l.5 si 5 genes | 1.0 si 5 genes | 0.5 si 5 genes | 0.25 si 5 genes |
| Tiel | 1.02 ± 0.16 | 0.15 ± 0.02 | 0.22 ± 0.05 | 0.33 ± 0.08 | 0.60 ± 0.06 |
| Tie2 | 0.90 ± 0.08 | 0.37 ± 0.02 | 0.43 ± 0.02 | 0.38 ± 0.04 | 0.56 ± 0.03 |
| VE-cad | 0.88 ± 0.18 | 0.26 ± 0.01 | 0.31 ± 0.07 | 0.49 ± 0.13 | 0.75 ± 0.09 |
| VEGFR-2 | 0.99 ± 0.13 | 0.22 ± 0.03 | 0.23 ± 0.03 | 0.41 ± 0.09 | 0.65 ± 0.04 |
| ICAM2 | 1.15 ± 0.26 | 0.24 ± 0.04 | 0.34 ± 0.09 | 0.65 ± 0.28 | 1.13 ± 0.14 |
| c | |||||
| Tie1 | 1.22 ± 0.15 | 0.25 ± 0.03 | 0.31 ± 0.04 | 0.48 ± 0.08 | 0.87 ± 0.11 |
| Tie2 | 1.35 ± 0.19 | 0.31 ± 0.04 | 0.32 ± 0.03 | 0.48 ± 0.09 | 0.92 ± 0.09 |
| VE-cad | 0.92 ± 0.06 | 0.49 ± 0.16 | 0.67 ± 0.03 | 0.73 ± 0.14 | 1.19 ± 0.07 |
| VEGFR-2 | 1.46 ± 0.27 | 0.32 ± 0.08 | 0.54 ± 0.09 | 0.93 ± 0.14 | 0.93 ± 0.13 |
| ICAM2 | 1.24 ± 0.24 | 0.54 ± 0.11 | 0.65 ± 0.08 | 0.89 ± 0.14 | 1.23 ± 0.07 |
| d | |||||
| Tie1 | 1.15 ± 0.20 | 0.65 ± 0.12 | 0.78 ± 0.12 | 0.89 ± 0.15 | 0.84 ± 0.15 |
| Tie2 | 0.92 ± 0.15 | 0.56 ± 0.12 | 0.80 ± 0.10 | 0.79 ± 0.04 | 0.67 ± 0.23 |
| VE-cad | 1.17 ± 0.48 | 0.77 ± 0.11 | 0.98 ± 0.22 | 0.96 ± 0.14 | 0.85 ± 0.22 |
| VEGFR-2 | 0.90 ± 0.20 | 0.81 ± 0.10 | 0.95 ± 0.20 | 0.88 ± 0.10 | 0.86 ± 0.15 |
| ICAM2 | 1.15 ± 0.33 | 1.08 ± 0.13 | 1.42 ± 0.22 | 1.07 ± 0.09 | 0.93 ± 0.10 |