
Figure 4.
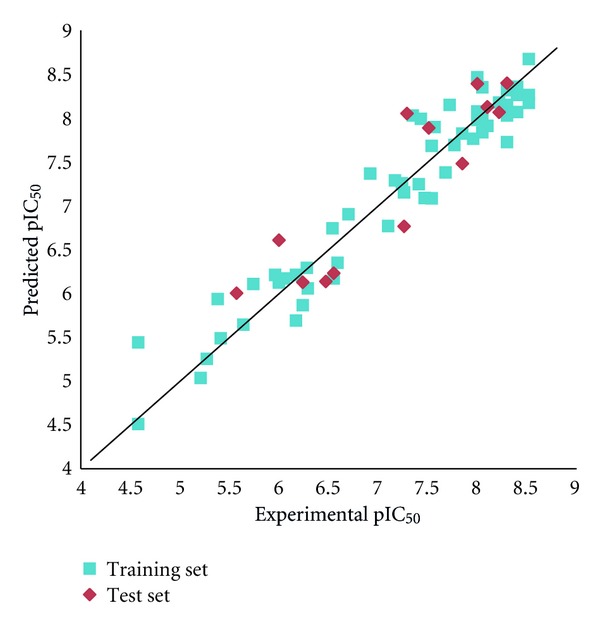
Plots of the experimental versus predicted pIC50 values using the training set of 56 molecules and the test set of 14 molecules.
Official websites use .gov
A
.gov website belongs to an official
government organization in the United States.
Secure .gov websites use HTTPS
A lock (
) or https:// means you've safely
connected to the .gov website. Share sensitive
information only on official, secure websites.
Plots of the experimental versus predicted pIC50 values using the training set of 56 molecules and the test set of 14 molecules.