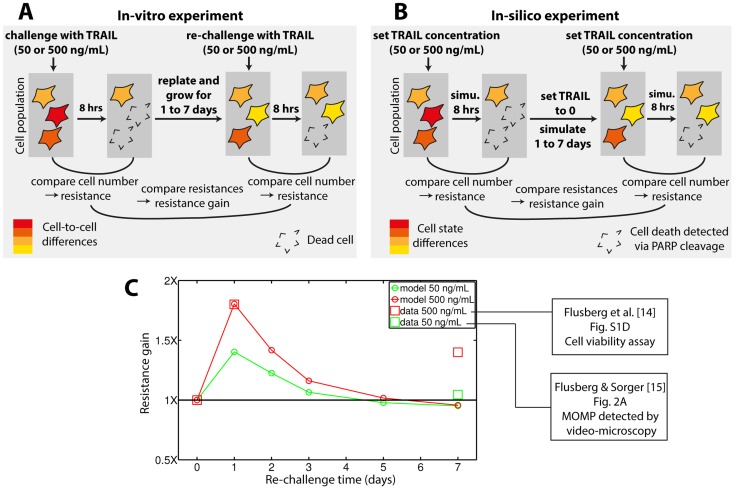
Figure 6. Reversible resistance in repeated TRAIL treatments.
(A) Schematic description of the ‘repeated TRAIL’ experiments performed in [14], [15] to characterize reversible resistance in HeLa cells. (B) In-silico reproduction of these experiments with our model (details in Supplementary Methods, Text S1). (C) Resistance gains in surviving cells relative to naïve cells as a function of time between the two TRAIL treatments. Data are shown for experimental observations [14], [15] and model predictions (our study). Comparison of resistance gain experimental measurements between the two TRAIL doses (500 and 50 ng/mL for [14] and [15] respectively) should be done with care, as the measurement and quantification method differed.

