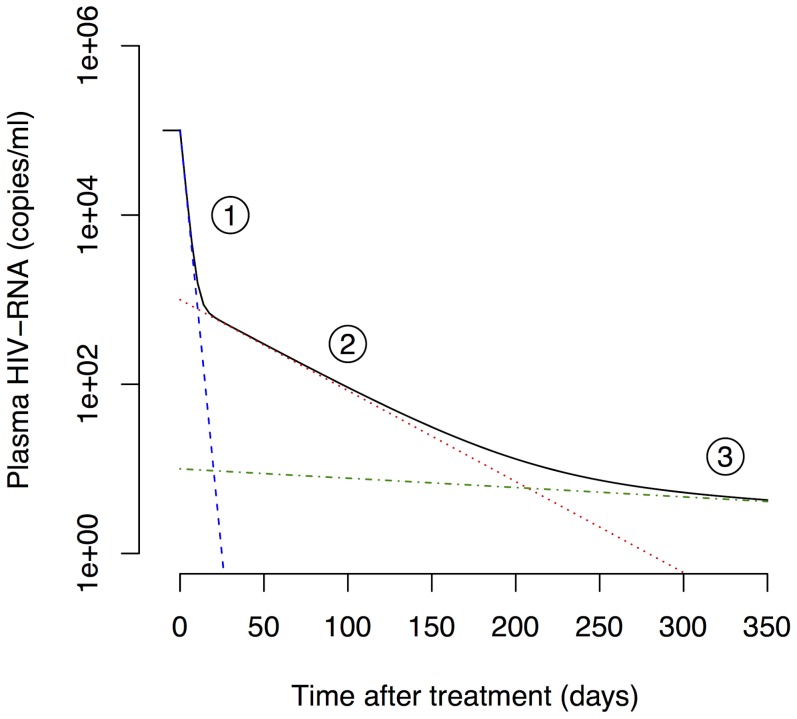
Figure 1. Three-phase decay of HIV-1 after start of cART.
The black line shows a typical decay profile of plasma viral load during the first year of cART. Typical half-lives of the first (blue dashed line), second (red dotted line) and third phase (green dash-dotted line) are 1.5 days, 4 weeks and 39 weeks, respectively [22].

