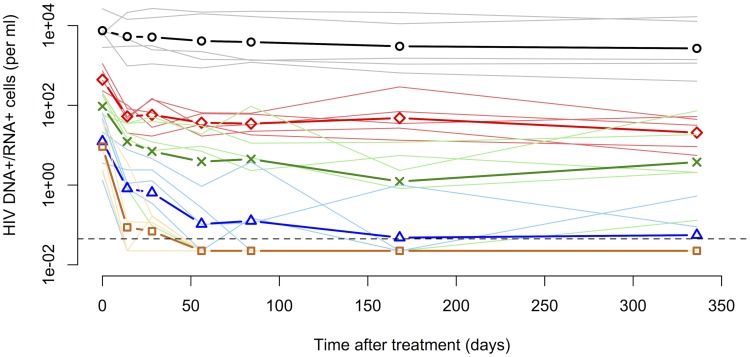
Figure 2. Decay kinetics of subclasses of HIV-1-infected cells during cART.
The five subclasses of PBMCs are: DNA (containing HIV-1 DNA, black circles), Low (containing solely HIV-1 UsRNA, red diamonds), Mid (containing only HIV-1 MsRNA-tatrev or MsRNA-nef, green crosses), High (containing elevated levels of both HIV-1 MsRNA-tatrev and MsRNA-nef, blue triangles) and Extra (carrying virion-enclosed HIV-1 RNA, chocolate squares). Thick lines and symbols represent the geometric means of the five patients from the study by Fischer et al. [12]. Thin transparent lines for each color represent the original data for each subclass of cells of each individual patient. The dashed line represents the limit of detection that was set at 50% of the lowest measured cell count. Measurements below this threshold were assumed to be at 50% of the detection limit to include them in the mean.

