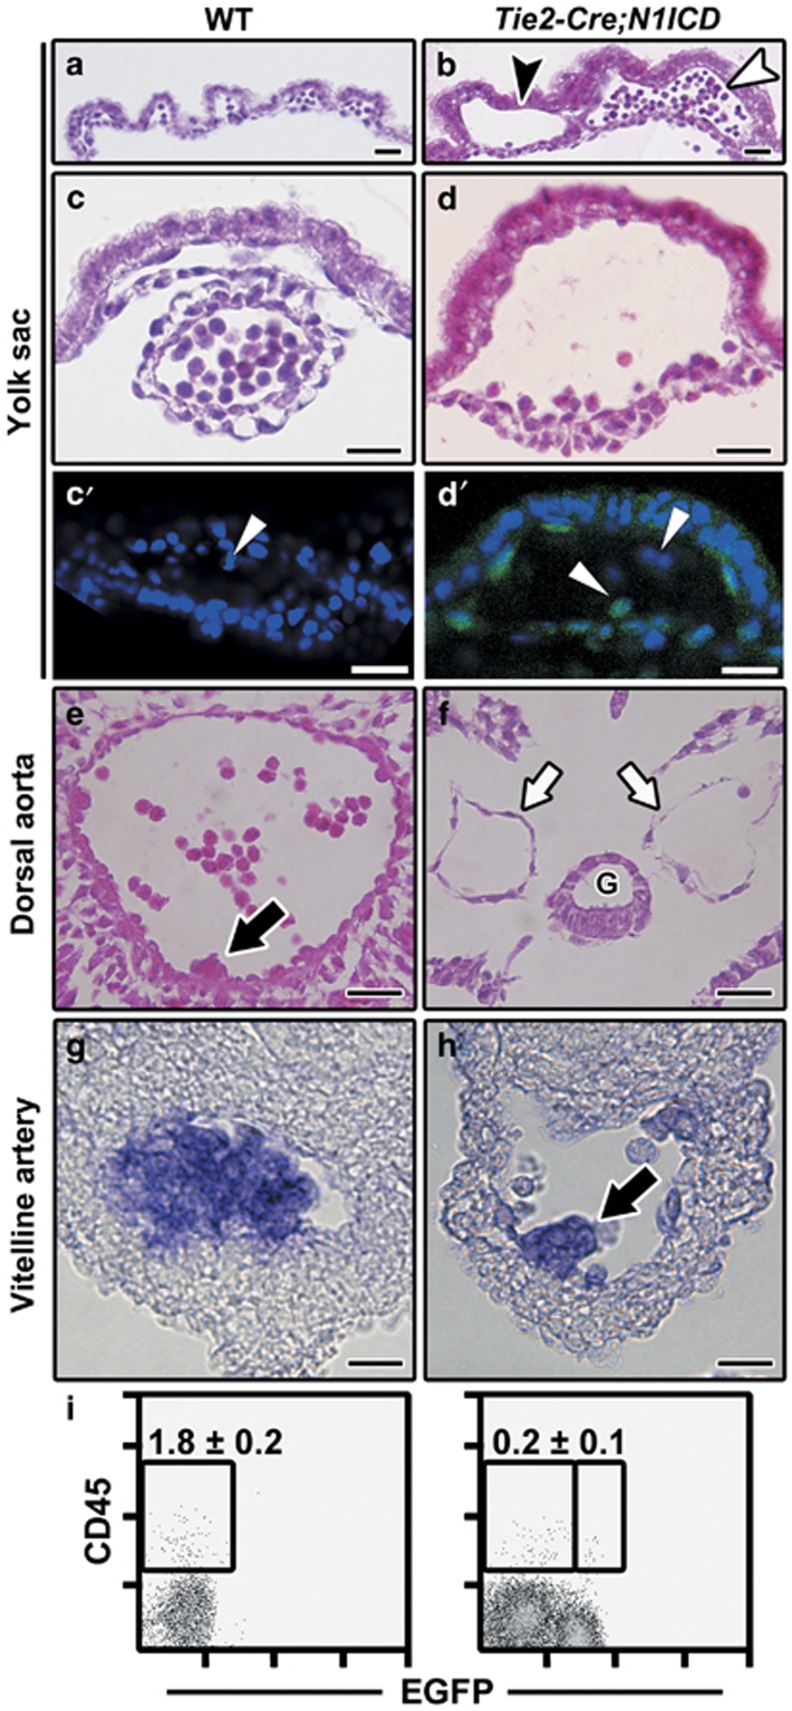
Figure 2.
Tie2-Cre;N1ICD embryos display severe vascular alterations and a blockade of intraembryonic definitive hematopoiesis. (a–d) Bright-field images of H&E-stained transverse sections of YS from E9.5 WT (a, c) and Tie2-Cre;N1ICD (b, d) embryos, showing the differences in blood vessel diameter and circulating cell number. Transgenic YS (b) exhibits two types of blood island, with the lumen empty (black arrowhead) or with a high concentration of circulating cells (white arrowhead). Panels (c) and (d) show detailed views of a normal blood vessel in WT YS (c) and a dilated vessel of Tie2-Cre;N1ICD YS (d). (c′, d′) Confocal image of a WT (c′) and Tie2-Cre;N1ICD YS (d′) stained with DAPI. The white arrowheads in point to the circulating cells in WT YS that do not express EGFP (c′), and to EGFP+ coexisting with EGFP− circulating cells in the transgenic YS (d′). (e, f) Transverse sections of E9.5 dorsal aorta at the P-Sp/AGM region level in WT (e) and Tie2-Cre;N1ICD embryos (f); transgenic animals have bilateral dorsal aortas (white arrows) and lack the hematopoietic cell clusters that start to bud off from the endothelium in WT embryos (black arrows in e). G, gut. (g, h) In situ hybridization of AML1/Runx1 in WT (g) and Tie2-Cre;N1ICD (h) vitelline artery. Hematopoietic cells almost obliterate the lumen of WT vitelline artery, whereas a single small hematopoietic cell cluster is seen in the Tie2-Cre;N1ICD vessel (black arrow in h). (i) Dot plots showing a marked reduction in the CD45+ cell population in the caudal portion of Tie2-Cre;N1ICD (right) versus WT (left) embryos. Data show frequency (mean±S.E.M., N=3). Scale bars: 25 μm

