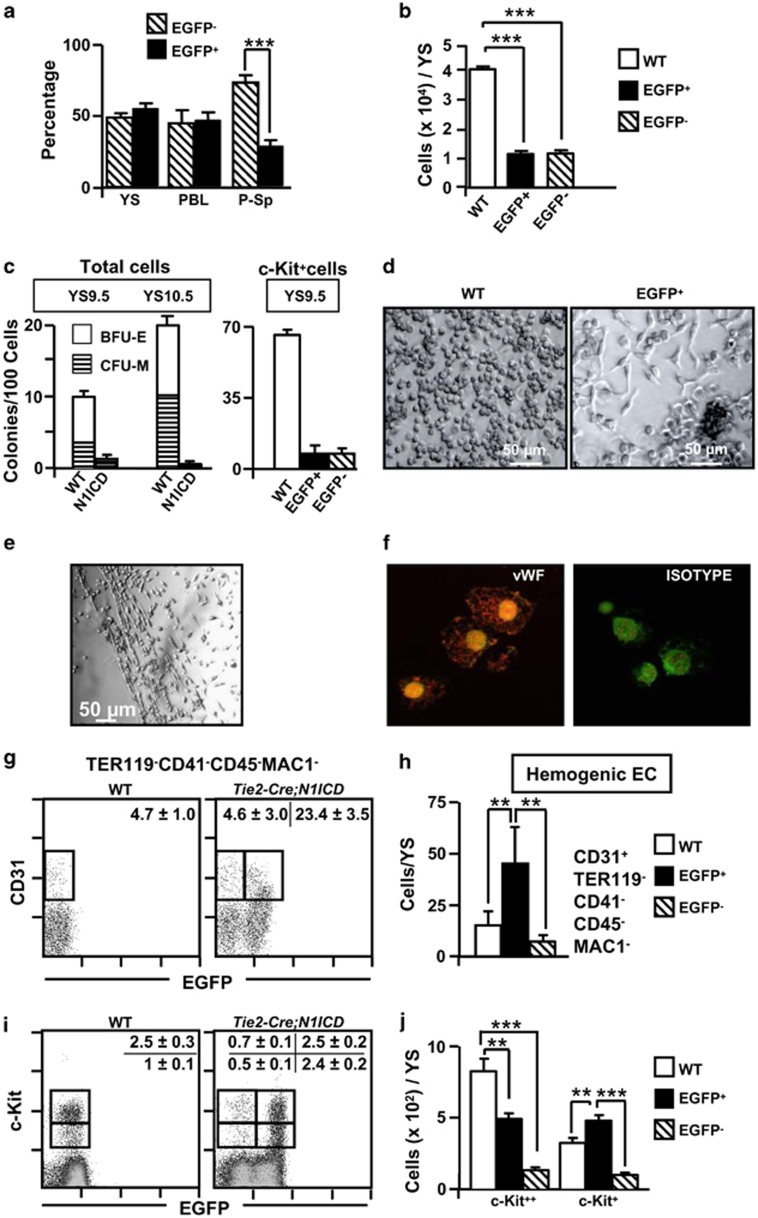
Figure 3.
Immature progenitor cell populations in E9.5 Tie2-Cre;N1ICD mice have a weak hematopoietic potential and maintain endothelial progenitors. (a) Contribution of EGFP− and EGFP+ (N1ICD transgene-expressing) cells to YS, blood and P-Sp in E9.5Tie2-Cre;N1ICD embryos. The graph shows the relative percentage of EGFP+ and EGFP− cells in preparations of the indicated cell suspensions (mean±S.E.M., N=13 for YS and P-Sp and N=7 for blood). (b) N1ICD expression in Tie2-Cre;N1ICD YS reduces the numbers of cells expressing and not expressing the transgene at E9.5. Bar chart shows quantification of YS cells in WT and in Tie2-Cre;N1ICD EGFP− and EGFP+ cell populations. Bars represent mean±S.E.M. (N=15). (c) Hematopoietic potential of WT and Tie2-Cre;N1ICD YS cells. Cells were cultured in MethoCult3434 medium for 7 days. Graphs show the absolute numbers of BFU-E and CFU-M (erythroid and myeloid, respectively) per 100 cells, detected in cultures of total cells at E9.5 and E10.5 (left) or from FACS-purified c-Kit-expressing progenitor cells of WT and EGFP− and EGFP+ Tie2-Cre;N1ICD cells at E9.5 (right). Data are mean±S.E.M. (N=3). (d) Microphotographs showing representative colonies of WT and EGFP+ cells. The periphery of EGFP+ colonies is populated by elongated, polarized cells. (e) Pseudo-endothelial structures formed after in vitro culture of EGFP+ CFUs on fibronectin-coated plates in the presence of the pro-endothelial factors bFGF and VEGF. (f) Merged microphotographs of EGFP+ CFU cells stained with vWF antibody (left) or with an isotype control antibody (right). (g) Representative cytometry plots of E9.5 YS cells from WT and Tie2-Cre;N1ICD mice stained for CD41, CD31, CD45, TER119 and CD11b/Mac1. CD41+CD45+TER119+CD11b+ cells were electronically excluded, and CD31+ is plotted showing green channel fluorescence to identify EGFP+ cells. Boxed areas define hemogenic EC cells as CD31+CD41−CD45−TER119−CD11b−. Numbers are percentages of gated cells, as mean±S.E.M, (N=4). (i) Representative cytometry plots of E9.5 YS cells from WT and Tie2-Cre;N1ICD mice stained for c-Kit, and plotted against green fluorescence channel. Boxes define c-Kit+ and c-Kit++ cell populations, and numbers are percentages of gated cells, as mean±S.E.M. (N=25). (h, j) The graphs show the number of cells of each population per YS; bars are mean±S.E.M,; data were calculated from the total YS cell counts presented in (b). Bars are labeled as in (b). **P<0.01, ***P<0.001

