Figure 4.
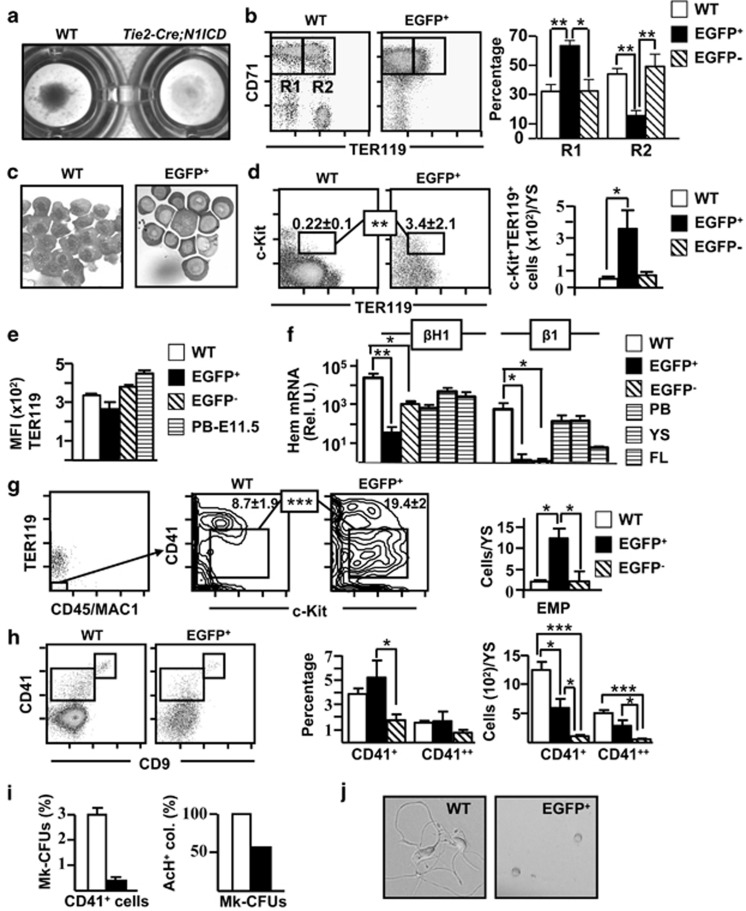
Abnormal erythroid and megakaryocyte differentiation in Tie2-Cre;N1ICD YS. (a) YS cells centrifuged on 96-well plates, revealing the low hemoglobin content of Tie2-Cre;N1ICD YS, indicating defective erythroid differentiation. (b) Representative dot plots of double-stained WT and electronically gated EGFP+ cells for the erythroid marker TER119 and the transferrin receptor CD71. Boxed areas define CD71++TER119− (R1) and CD71++/TER119+ (R2) cells. The graph in the right shows the relative percentage of R1 and R2 cell populations (mean±S.E.M.; N=6) in WT and electronically gated EGFP+ and EGFP− cells. (c) Microphotographs of May Grümwald-Giemsa staining in WT and FACS-purified EGFP+ Tie2-Cre;N1ICD cells. (d) Representative dot plots of WT and electronically gated EGFP+ cells for TER119 and c-Kit. Numbers are relative percentages of the TER119+c-Kit+, cells boxed (mean±S.E.M.; N=6). The right graph shows the quantification of numbers of TER119+c-Kit+ cells/YS calculated as in Figure 3j (mean±S.E.M.; N=6) for WT and electronically gated EGFP+ and EGFP− cells. (e) The graph represents the mean fluorescence intensity (MFI) data obtained from E9.5 WT and electronically gated EGFP+ and EGFP− cells from Tie2-Cre;N1ICD mice stained for TER119, as mean±S.E.M. (N=4). Staining of blood cells at E11.5 is shown as a control. (f) Quantifications of embryo-derived primitive (βH1) and definitive (β1) hemoglobins are shown in the bar graph. WT and FACS-purified EGFP+ and EGFP− Tie2-Cre;N1ICD cells were submitted to RNA extraction, cDNA was synthesized and RT-qPCR was performed as indicated in Materials and Methods. The Bio-Rad CFX Manager software was used to calculate the CT of each reaction, and the relative amount of specific cDNA in each sample was determined by the ΔCT method. Results are displayed as the relative expression of each transcript over Gα gene expression (mean±S.E.M.; N=4). (g) Representative FACS analysis of WT and Tie2-Cre;N1ICD mice stained for TER119, CD45/Mac1, CD41 and c-Kit. TER119−CD45/Mac1− cells were gated (left dot plot) and analyzed for CD41 and c-Kit, as indicated in the plots from WT and electronically gated EGFP+ cells. The boxes identify the c-Kit+CD41+ erythro-myeloid progenitor (EMP) population; numbers are percentages (mean±S.E.M.; N=4). The right graph shows the EMP quantification/YS calculated as in Figure 3j (mean±S.E.M.; N=4) for WT and electronically gated EGFP+ and EGFP− cells. (h) Representative FACS analysis of WT and electronically gated EGFP+ cells stained for CD9 and CD41. Boxed areas define the double-positive CD9++CD41++ megakaryocytic population and the CD9+CD41+ cell population. The graphs in the right show the relative percentages and absolute numbers of both cell populations in WT and electronically gated EGFP+ and EGFP− Tie2-Cre;N1ICD YS (N=5). (i) Left panel, Representative graph of the relative percentage of megakaryocyte progenitors (MK-CFUs) present in FACS-purified CD41+ cells from WT versus EGFP+ populations (N=3). Right panel, Relative percentages of MK-CFUs expressing acetylthiocholiniodide (AcH) in WT versus EGFP+ cells (N=3). (j) Microphotographs showing cultures of CD9++CD41++ FACS-purified cells from E9.5 WT and EGFP+ Tie2-Cre;N1ICD YS cells at 48 h of culture. *P<0.05, **P<0.01, ***P<0.001

