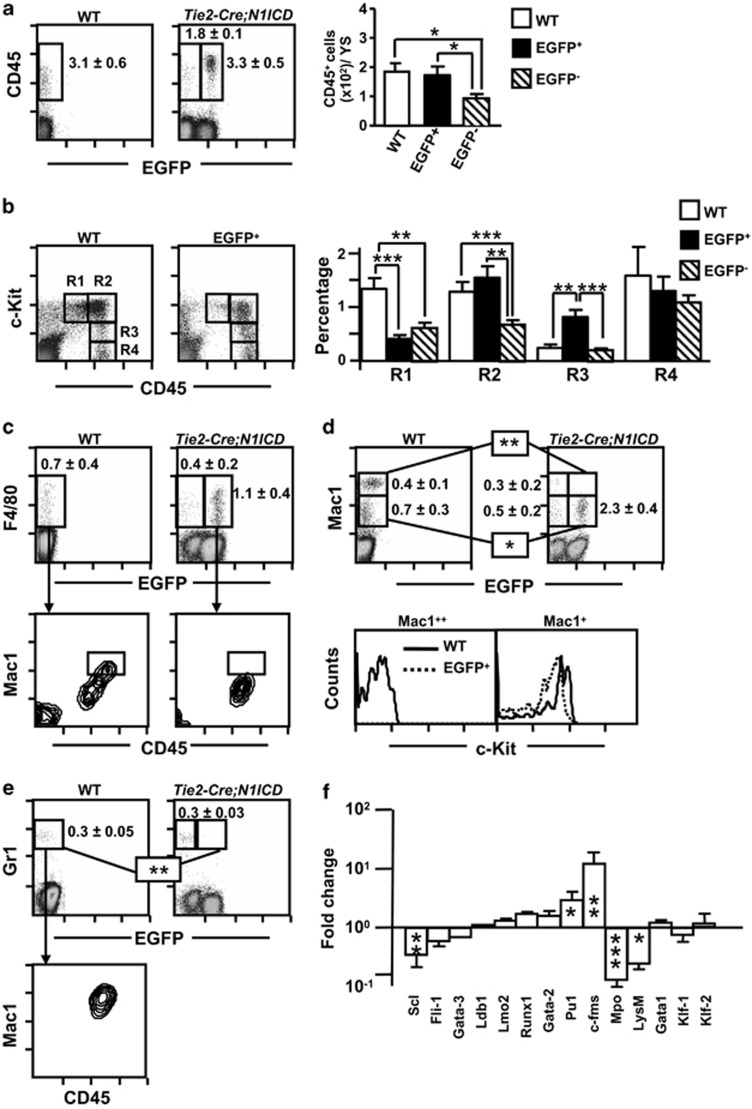
Figure 5.
N1ICD inhibits the differentiation of YS myeloid progenitors. Total WT and Tie2-Cre;N1ICD YS cells were stained with the indicated antibodies and analyzed by flow cytometry. (a) CD45+ cell numbers are elevated in YS from Tie2-Cre;N1ICD mice at E9.5. Dot plots show a representative detection of myeloid CD45+ cells (boxed areas) in WT and Tie2-Cre;N1ICD preparations. Inside the plots cell percentages are shown as mean±S.E.M., N=15. The bar chart shows the number of CD45+ cells per YS, calculated for each sample using the corresponding data presented in Figure 3b. (b) Dot plots of WT and electronically gated EGFP+ YS cells stained for the hematopoietic markers CD45 and c-Kit. Gates define the following subpopulations: c-Kit++CD45+ (R1), c-Kit++CD45++ (R2), c-Kit+CD45++ (R3) and c-Kit−CD45++ (R4). The bar chart shows relative percentages of electronically gated WT and EGFP+ and EGFP− Tie2-Cre;N1ICD YS cells as mean±S.E.M., N=10. (c) Upper panel: dot plots show a representative detection of the macrophage marker F4/80, boxed areas with relative percentages as mean (±S.E.M., N=4), in total WT and Tie2-Cre;N1ICD YS cells, detected in the green fluorescence channel to identify EGFP+ cells. Lower panel: dot plots show Mac1 and CD45 expression in electronically gated WT F4/80+ cells and EGFP+F4/80+cells. The boxed areas highlight a Mac1++CD45++ subpopulation not found among EGFP+F4/80+cells. (d) Mac1 antibody staining in total WT and Tie2-Cre;N1ICD YS cells, displayed as in (c). The boxes mark the Mac1+ and Mac1++ subpopulations, with relative numbers shown to the right as mean±S.E.M., N=4; Mac1++ cells are absent in EGFP+ transgenic mice. The lower histograms show c-Kit-stained cells in the electronically gated Mac1+ and Mac1++ subpopulations from WT or EGFP+ YS. Mac1+ cells in WT (solid line) and EGFP+ (open line) YS cells (left histogram) co-express c-Kit. WT Mac1++ cells do not express c-Kit, indicating their more mature phenotype (right histogram). (e) Dot plots of Gr1 staining (boxed areas) showing the absence of Gr1+ cells in the EGFP+ Tie2-Cre;N1ICD YS cells. The percentage of Gr1+ cells is indicated as mean±S.E.M., N=3. The contour plot (bottom) shows co-expression of Mac1 and CD45 in electronically gated WT Gr1+ cells. (f) Quantitative PCR analysis of FACS-purified WT and EGFP+ cells for the expression of selected genes implicated in early hematopoiesis (SCL, Fli1, GATA3, Ldb1, Lmo2 and Runx1), myeloid development (GATA2, PU.1, c-fms, Mpo and LysM) and erythroid development (GATA1, KLF1 and KLF2). Data are shown as the fold change in mRNA expression level (ΔΔCt method) between EGFP+ cells from Tie2-Cre;N1ICD YS relative to WT YS cells. Bars are mean±S.E.M., N=3. *P<0.05, **P<0.01, ***P<0.001

