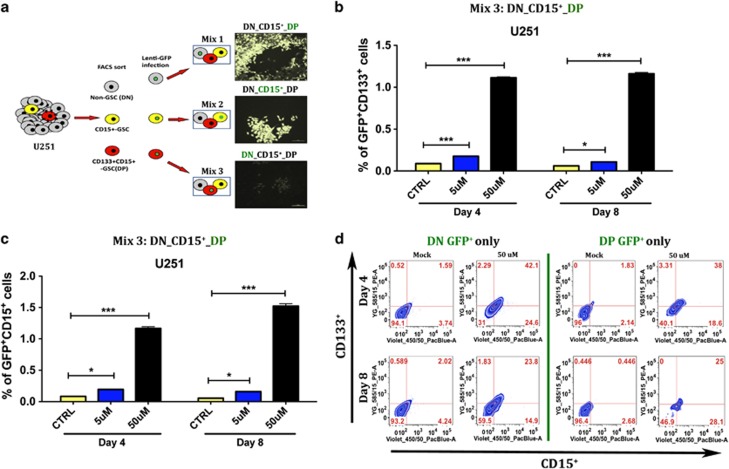
Figure 3.
Graphic representation of the increase in the GSC pool post-TMZ therapy in unsorted U251 glioma cells with GFP-tagged subpopulations (DN, CD15+, and DP). (a) Figure depicting the experiment set up with tagged GSC and non-GSC subpopulations. As there is no consensus on an optimal and most representative GSC marker, we used various single and combined markers to ratify our observations. (b) Plot depicting amplification of DP (GFP+) GSCs into CD133+ GSCs. TMZ triggered an amplification of the GFP-tagged CD133+ GSCs (GFP+CD133+) over time and in a dose-dependent manner (both with 5 and 50 μM of TMZ). Mock cells present a typical fluctuation in the GSC markers, with very low rates of GSCs (∼0.093%). The TMZ-triggered amplification of the GFP-tagged tumor cells aims to replenish the previously depleted GSC population, raising it to ∼1.16% at 8 days post-TMZ therapy (50 μM). (c) Similar representation showing the amplification of the DP GSC population (GFP-tagged). Now such amplification is measured by an increase in single-positive CD15 GSC markers. (d) Both unsorted DN (first column) and DP (second column) U251 GFP-tagged cells show an increase in the GSC population at 4 and 8 days post-initial TMZ therapy. Here we look for the presence of double-positive (CD133+CD15+) GSC markers. We see both a significant conversion of non-GSCs into DP GSCs (P<0.001) and an amplification of the DP GSCs (P<0.001). P-values represent the average of at least five samples, P: ns (P>0.05), *P<0.05, ***P<0.001, one-way analysis of variance

