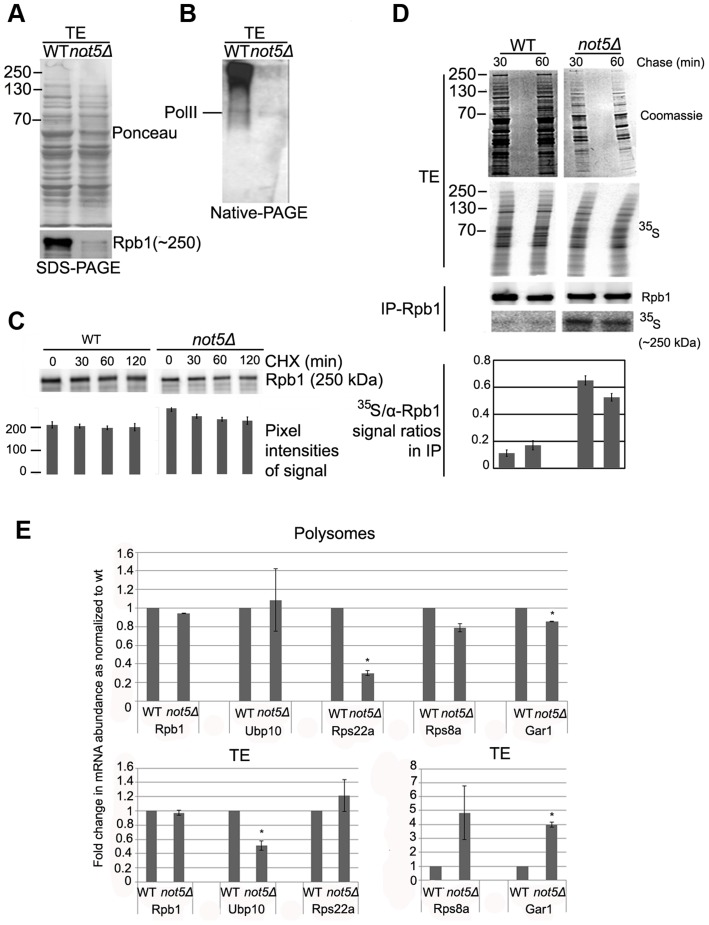
Figure 5. The levels of soluble Rpb1 are decreased in not5Δ.
A and B. Total soluble extracts were analyzed by SDS-PAGE (A) or Native-PAGE (B) and membranes were stained with Ponceau (upper panel in A) or probed with antibodies against Rpb1 (B and lower panel in A). C. Cells were grown exponentially to an OD600 of 1.0 and then CHX (100 µg ml−1) was added. 0.8 OD600 units of wild-type cells and 1.6 OD600 units of not5Δ were collected at the indicated times after protein synthesis arrest. Total proteins prepared by post-alcaline lysis were analyzed by western blotting with antibodies against Rpb1. Quantification of the blots (shown below the blots) revealed no significant difference in the reduction of Rpb1 over time in the 2 strains. D. Wild- type and not5Δ cells were metabolically labeled with 35S for 5 min then chased with cold methionine for 30 and 60 min. Total extracts (TE) were prepared and counted for 35S incorporation. The same amount of labeled total protein (20’00 cpm) from both strains (corresponding to 10 µg of protein from wt and 2.5 µg from not5Δ) was separated by SDS-PAGE. The gel was stained by Coomassie (TE, Coomassie), dried and then exposed (TE, 35S). The same amount of labeled protein from each extract (corresponding to 2 mg of protein from wt and 0.5 mg of protein from not5Δ) was also incubated with antibodies against Rpb1, and the immunoprecipitate was analyzed by western blotting (IP-Rpb1, Rpb1). The membranes were also exposed (IP-Rpb1, 35S). Quantified ratios of the 35S-Rpb1 signal and anti-Rpb1 signal from the western blotting are shown below the blots. E. Total extracts from wild-type or not5Δ were separated on sucrose gradients as in Fig. 1C, and RNA was extracted from the total extracts (TE, lower panels) or polysome fraction 14 (Fig. S15) (Polysomes, upper panels). The amount of the indicated mRNAs were evaluated by RT followed by qPCR in 1 µg of total and polysomal RNA. Values were normalized to the level of NIP1 mRNA that showed no change in abundance between the wild-type and not5Δ in total extracts or polysome fractions (Fig. S7). All mRNA levels are expressed relative to the level in the total extract of the wild-type expressed as 1. * represents statistically significant differences in mRNA abundance between wild-type and not5Δ samples at p<0.05.

