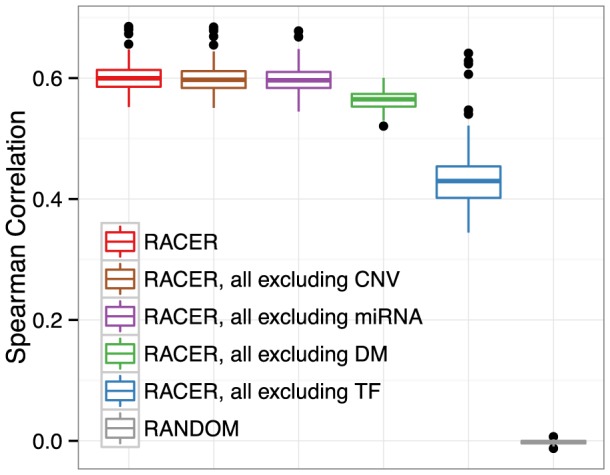
Figure 2. Model comparison.

Boxplot of Spearman rank correlation between the predicted and the actual held-out genes in 10-fold cross-validation (CV). The full RACER model (red, left most) using all of the input variables was compared with the reduced model using all except for one type of the input variables “RACER, all excluding X”, where × is one of the following factors: CNV (copy number variation), miRNA (miRNA expression  number of conserved target sites), DM (DNA methylation), TF (TF binding scores from ENCODE). RANDOM represents predictions from the complete RACER model on the same data but with gene labels randomly shuffled. The 10-fold CV was performed for each sample, and the average was taken over the 10 correlations. Each boxplot displays the distribution of the averaged correlation across the 173 AML samples. The higher the reduction relative to the full RACER model, the more power provided by the excluded variables in terms of explaining the underlying mRNA expression level.
