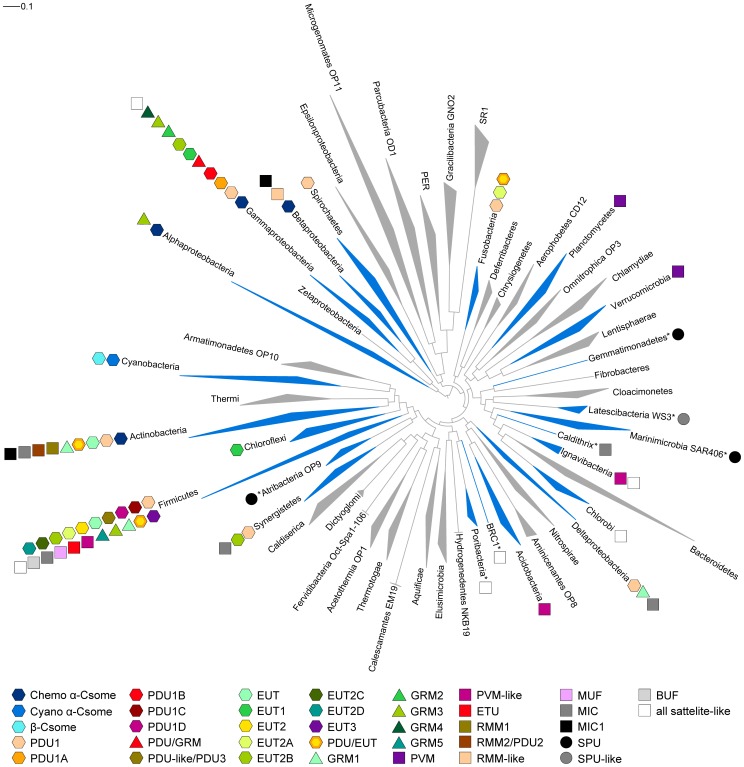
Figure 6. Bacterial phyla tree with distribution of BMC locus types.
The classified BMC locus types, excluding satellite and satellite-like loci, denoted as colored shapes are adjacent to the phyla in which they appear. For a given phylum, the shape of the triangular wedge represents sequence diversity; the nearest edge represents the shortest branch length from the phylum node to a leaf, while the farthest edge represents the longest branch length from the phylum node to a leaf. Phyla marked with an asterisk (*) are not in NR but contain BMC loci; the data were retrieved from IMG (Materials and Methods). Phylum tree based on [52] with expansion by Christian Rinke.

