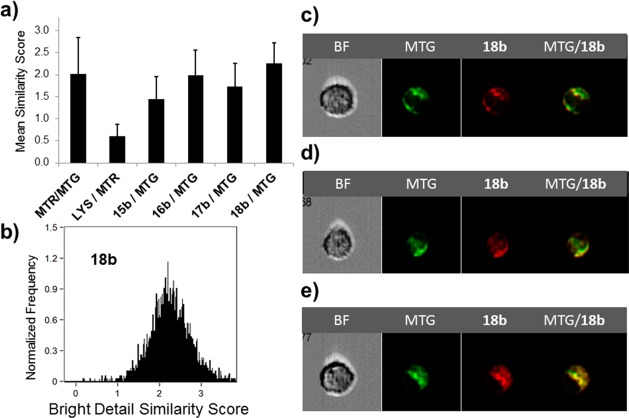
Figure 5.
(a) The average similarity coefficient determined by ImageStream flow cytometry of all cells for each pair of agents (MTR, MTG, LYS, 15b–18b) is shown; error bars represent SD. (b) Histogram of the pixel-by-pixel statistical analysis of each cell (n = 3900) analyzed, in which the y-axis is number of cells and the x-axis is the similarity coefficient between MitoTracker Green and 18b. Shown are representative examples of 18b/MTG-stained Colo-26 cells as a bright field image (BF), MTG fluorescence, 18b fluorescence, and a merged image of MTG/18b fluorescence for cells with (c) low similarity, (d) intermediate similarity, and (e) high similarity.

