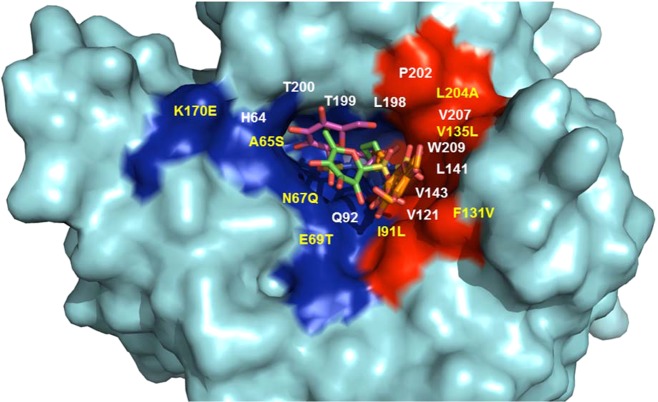
Figure 3.
Surface representation depicting the location of 5e (in both CA II and CA IX-mimic) and 5d (in CA IX-mimic, only). Highlighted hydrophobic (red) and hydrophilic (blue) residues. Relative location of interfacing residues are labeled. Residues that differ between CA II and CA IX (and CAIX mimic) (yellow) and that are conserved (white). Figure was made using PyMol.16

