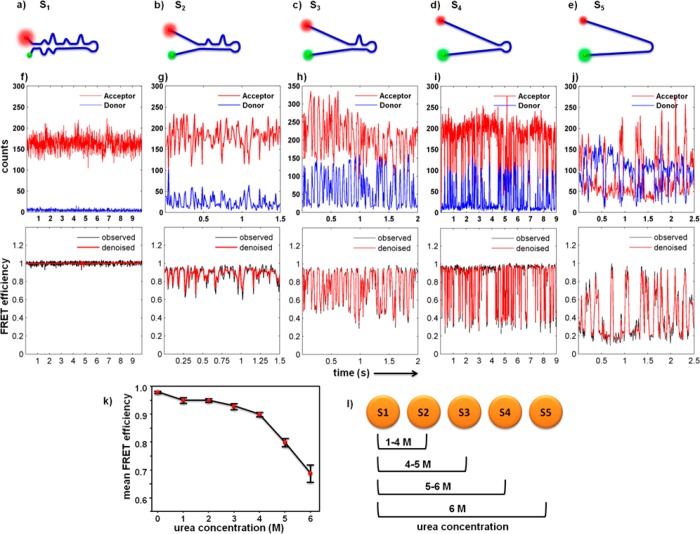
Figure 6.
Proposed structures and smFRET trajectories with their FRET efficiencies showing five different states of TAR–DNA in its folded form S1 (a, f), 0–2 M urea (scheme showing as an example structure of the state); S2 (b, g), 3 M urea; S3 (c, h), 4 M urea; S4 (d, i), 5 M urea; and unfolded hairpin form S5 (e, j), 6 M urea in the absence of Mg2+ (full trajectories shown in the Supporting Information). (k) The mean FRET efficiency as a function of urea concentration represents the denaturing (unfolding) of the DNA. Error bars are standard deviation of three measurements, >20 molecules for each urea concentration at different days for three different samples. Relatively small error bars indicate that the number of molecules is large enough to represent ensemble average. (l) Number of states observed under our specific experimental conditions.

