Figure 7.

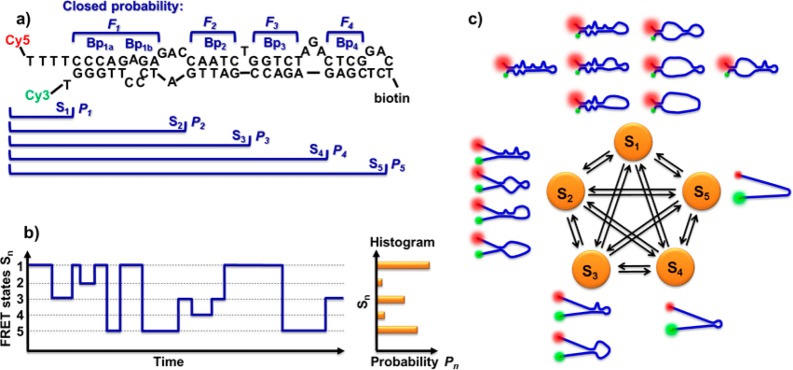
(a) Scheme of the breaking points of TAR–DNA. The four breaking points (Bpn) define five states Sn, and each state has probability of Pn to be observed in smFRET experiments. Each breaking point has a closed probability Fn. Bp1a and Bp1b are jointed together as has been discussed earlier in the main text. (b) Scheme of smFRET trajectory with random transitions between states. The histogram summarizes the random trajectory with the bars representing the probabilities of observing the states. (c) Scheme of the microstates and the transitions between the five FRET states.
